Free Access
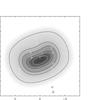
Fig. 24
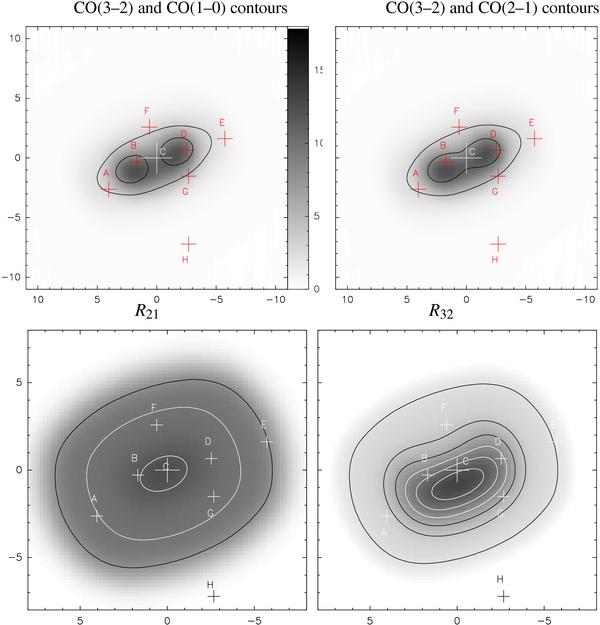
The upper panels show the CO integrated maps produced by the clumpy flared disk toy model described in Appendix A.2. The CO(3–2) emission is shown in greyscale, and the CO(1–0) (left panel) and CO(2–1) emission (right panel) are contours. The lower left and right panels show the resulting R21 and R32 maps, respectively.
This figure is made of several images, please see below:
Current usage metrics show cumulative count of Article Views (full-text article views including HTML views, PDF and ePub downloads, according to the available data) and Abstracts Views on Vision4Press platform.
Data correspond to usage on the plateform after 2015. The current usage metrics is available 48-96 hours after online publication and is updated daily on week days.
Initial download of the metrics may take a while.