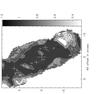
Fig. 18
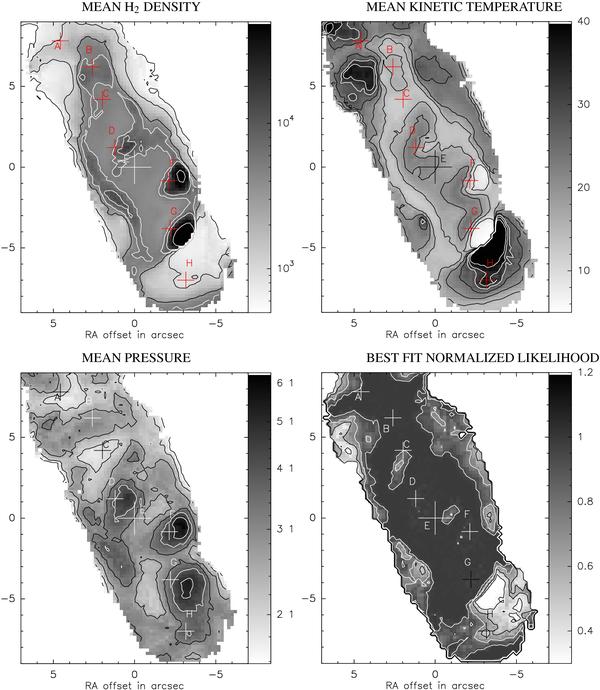
LVG result maps for NGC 4569. Upper left: H2 number density averaged over the 90% confidence interval of each LVG model. The black contours are at 5 × 10², 103, 3 × 103 cm-3 and the white contours at 5.5 × 10³, 104, and 5 × 104 cm-3. Upper right: kinetic temperature averaged over the 90% confidence interval of each model. The black contours are at 5, 10, 15, 20, 25 K and the white contours at 30, 35, 40 K. Lower left: pressure averaged over the 90% confidence interval of each model. The black contours are at 104.1, 104.4, and 104.7 K cm-3 and the white contours at 105, 105.3 and 105.6 K cm-3. Lower right: the normalized likelihood (or merit), P/Pmax, of the best fit with black contours at 0.35 and 0.55 and white contours at 0.75 and 0.95.
Current usage metrics show cumulative count of Article Views (full-text article views including HTML views, PDF and ePub downloads, according to the available data) and Abstracts Views on Vision4Press platform.
Data correspond to usage on the plateform after 2015. The current usage metrics is available 48-96 hours after online publication and is updated daily on week days.
Initial download of the metrics may take a while.