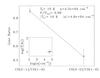
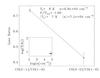
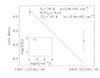
Fig. 17
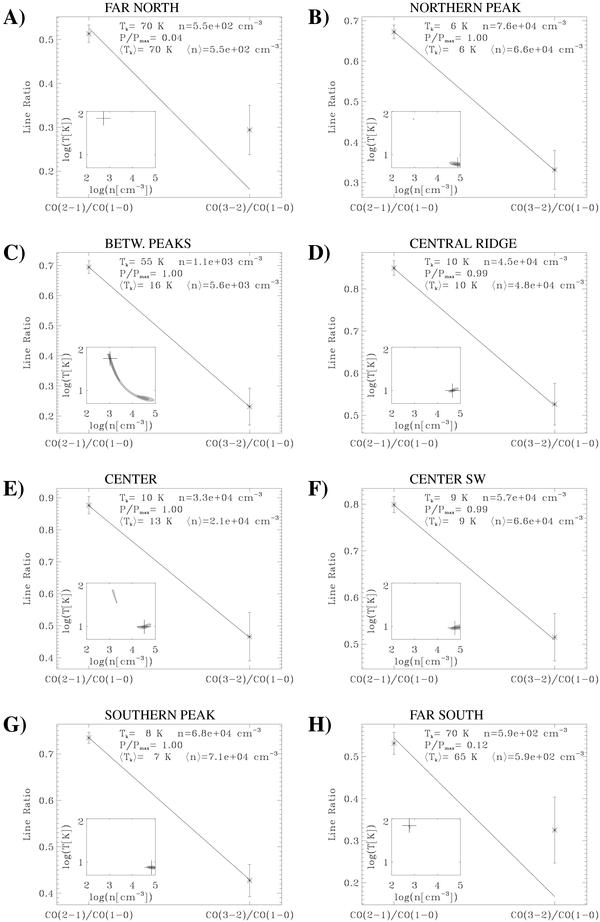
LVG best fits to the line ratios measured in the central region of NGC 4569 at the eight positions marked in Fig. 2. The measured line ratios are represented with the 1-σ error bars and the best fit model ratios are linked with a straight line. The inset in each plot shows the 90% confidence interval (light grey shaded area) and the 50% confidence interval (dark grey) in the density-temperature plane assuming a normal probability distribution for each ratio; the best fit solution is marked with a cross. The best fit temperature and density as well as the averages over the 90% confidence interval are given at the top right of each plot. The normalized likelihood of the best fit, P/Pmax is also given (1 means the measured values are exactly reproduced by the model).


Current usage metrics show cumulative count of Article Views (full-text article views including HTML views, PDF and ePub downloads, according to the available data) and Abstracts Views on Vision4Press platform.
Data correspond to usage on the plateform after 2015. The current usage metrics is available 48-96 hours after online publication and is updated daily on week days.
Initial download of the metrics may take a while.