Fig. 22
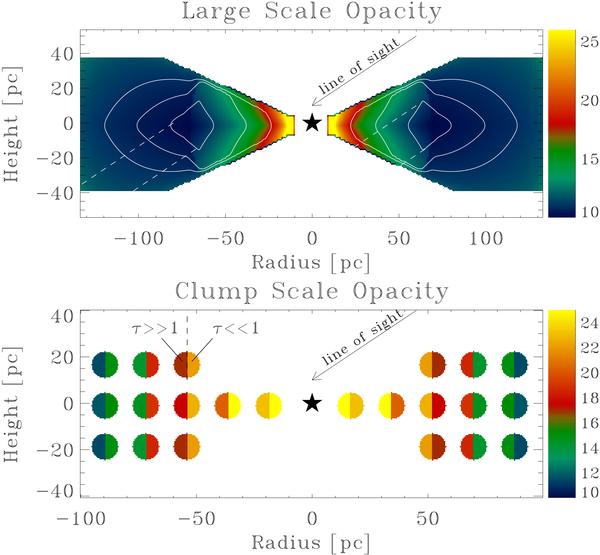
Sketches illustrating the two opacity effects considered in Sect. 6.2. In both panels the color scale is related to the temperature in K as shown in the colorbars and the star symbol represents the AGN. The observer is assumed to be looking from the top right, so that the right-hand side of the panels corresponds to the near side and the left-hand side to the far side of the galaxy. The top panel illustrates how the densest and coldest gas distributed in a ring at 70 pc from the center could partly obscure emission from the dense torus on the near side and from the galactic disk on the far side. The white contours correspond to density levels. The dashed white lines delineate the regions that would be obscured by the densest gas. The lower panel illustrates how clumps heated by the nucleus could have inhomogeneous properties with the side exposed to the nucleus being warmer, less dense and less opaque to CO emission than the other side.
Current usage metrics show cumulative count of Article Views (full-text article views including HTML views, PDF and ePub downloads, according to the available data) and Abstracts Views on Vision4Press platform.
Data correspond to usage on the plateform after 2015. The current usage metrics is available 48-96 hours after online publication and is updated daily on week days.
Initial download of the metrics may take a while.