Fig. 15
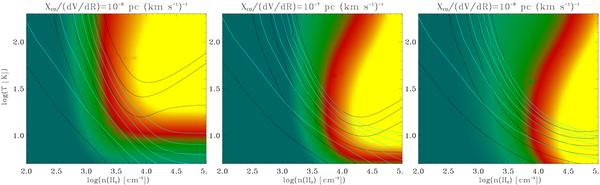
Grids of LVG models for a range of molecular hydrogen densities and kinetic temperatures. Each grid corresponds to a different value of XCO/(dV/dR), from left to right: 10-6, 10-7 and 10-8 pc (km s-1)-1. The CO(1–0) radiative temperature is represented in color scale and is overlaid with R21 black contours (0.3 to 1.3 in steps of 0.2) and R32 blue contours (0.1 to 0.6 in steps of 0.1). The line ratios increase from bottom left to top right.
Current usage metrics show cumulative count of Article Views (full-text article views including HTML views, PDF and ePub downloads, according to the available data) and Abstracts Views on Vision4Press platform.
Data correspond to usage on the plateform after 2015. The current usage metrics is available 48-96 hours after online publication and is updated daily on week days.
Initial download of the metrics may take a while.