Fig. 2
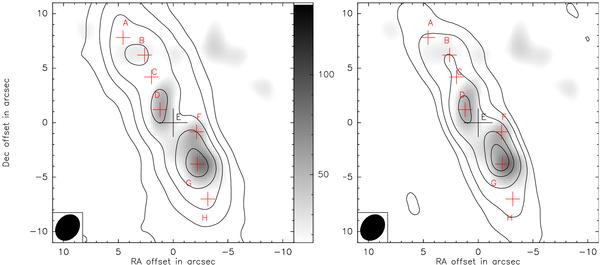
SMA CO(3–2) integrated map of NGC 4569 (grey scale given in the color bar in Jy km s-1 beam-1) overlaid with the PdBI CO(1–0) integrated map (left) with contours at 2, 6, 12, 20, and 30 Jy km s-1 beam-1 and the PdBI CO(2–1) integrated map (right) with contours at at 7, 21, 42, 70 and 87 Jy km s-1 beam-1. No primary beam correction has been applied. All maps have the same resolution (PdBI data have been tapered) and the beam (2.3″ × 2.1″) is shown at the bottom left. The black cross labelled E shows the position of the AGN (αJ2000 = 12h36m49 .s80, δJ2000 = 13°09′46 .′′3). It is also the dynamical center and the phase center for the observations. The other crosses indicate the positions of the spectra plotted in Fig. 4.
Current usage metrics show cumulative count of Article Views (full-text article views including HTML views, PDF and ePub downloads, according to the available data) and Abstracts Views on Vision4Press platform.
Data correspond to usage on the plateform after 2015. The current usage metrics is available 48-96 hours after online publication and is updated daily on week days.
Initial download of the metrics may take a while.