Fig. 8
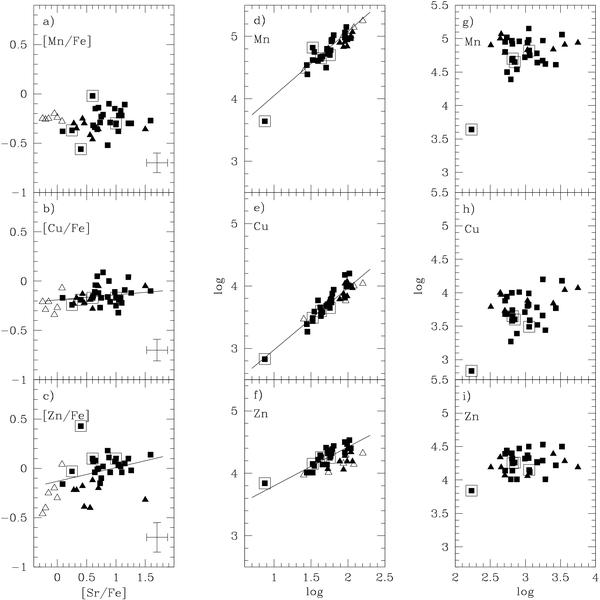
Symbols are the same as in Fig. 7. Panels a) − c) show [Mn, Cu, Zn/Fe] vs. [Sr/Fe]. The least-squares fits used only filled symbols. Panels d) − f) show log ϵ(X), where X is Mn, Cu, or Zn as a function of the logarithimic part of the fraction of Sr abundance with regard to the weak component of the s-process. The least-squares fits used all symbols. Panels g) − i) show log ϵ(X), where X is Mn, Cu, or Zn as a function of the logarithimic part of the fraction of Ba abundance relative to the main component of the s-process. The least-squares fits used only filled symbols. The results for the least-squares fits are given in Table 7.
Current usage metrics show cumulative count of Article Views (full-text article views including HTML views, PDF and ePub downloads, according to the available data) and Abstracts Views on Vision4Press platform.
Data correspond to usage on the plateform after 2015. The current usage metrics is available 48-96 hours after online publication and is updated daily on week days.
Initial download of the metrics may take a while.