Fig. 5
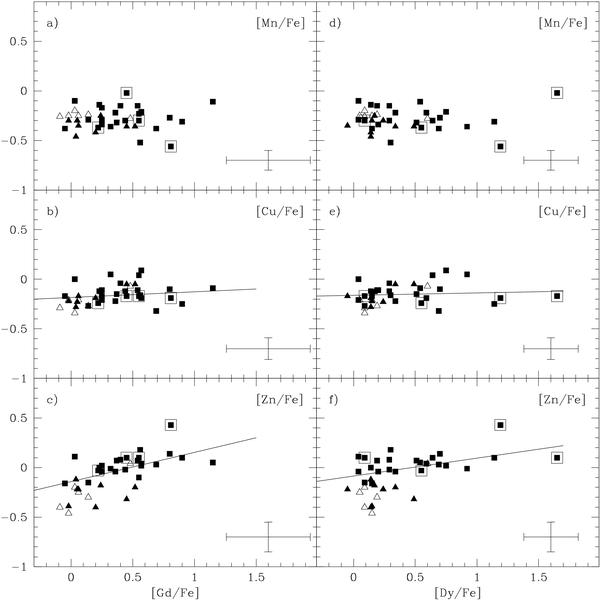
Abundance ratios invoving Mn, Cu, Zn, Gd, Dy, and Fe. Error bars are defined as in
Fig. 1. Symbols: triangles are results of
this work, where filled are barium stars and open, those stars considered to be
normal instead of barium stars by Smiljanic et al.
(2007); Filled squares: Allen & Barbuy
(2006a). Results of the least-squares fits are shown for each panel. Only
filled symbols were used in the fits. The straight line is shown only for fits with
 . The results for the least-squares
fits are given in Table 7.
. The results for the least-squares
fits are given in Table 7.
Current usage metrics show cumulative count of Article Views (full-text article views including HTML views, PDF and ePub downloads, according to the available data) and Abstracts Views on Vision4Press platform.
Data correspond to usage on the plateform after 2015. The current usage metrics is available 48-96 hours after online publication and is updated daily on week days.
Initial download of the metrics may take a while.