Fig. 4
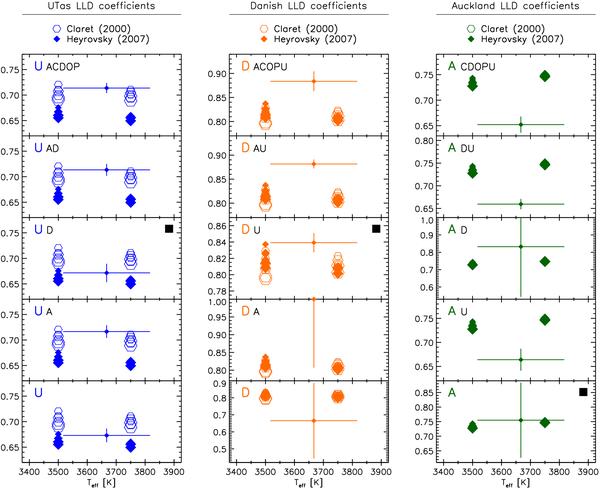
Graphical representation of the linear limb-darkening measurements (crosses) for the three data sets with sensitivity to limb-darkening: UTas in the I-band, Danish in the R-band, and Auckland in a clear filter. The open hexagons and the filled diamonds are the predictions from Claret (2000) and Heyrovský (2007) linear limb-darkening (LLD) coefficients. The fitting of the light curve is performed for different combinations of telescopes (same letter conventions as for Table 2), and the results are discussed in Sect. 5. The adopted measurements are those marked with black squares in the upper right of the panels.
Current usage metrics show cumulative count of Article Views (full-text article views including HTML views, PDF and ePub downloads, according to the available data) and Abstracts Views on Vision4Press platform.
Data correspond to usage on the plateform after 2015. The current usage metrics is available 48-96 hours after online publication and is updated daily on week days.
Initial download of the metrics may take a while.