Fig. 1
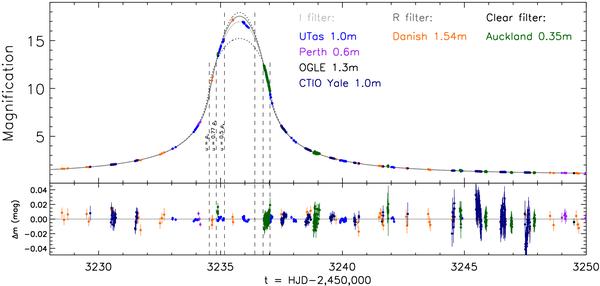
Light curve of OGLE 2004-BLG-482, with data from PLANET (Danish, UTas and Perth), OGLE and μFUN (CTIO-Yale and Auckland) collaborations. The two gray solid lines in the upper panel draw the best-fit model for the I and R filters with linear limb-darkening parameters given in Table 2. The two dotted curves correspond to the two extreme cases, Γ = 0 (uniformly bright source, lower dotted curve) and Γ = 1 (upper dotted curve). The two pairs of vertical dashed lines marked u = ρ∗ and u = 0.5 ρ∗ indicate when the lens is located at the limb of the source and half way from its centre to the limb. All the curves intersect at u = 0.77 ρ∗, also marked by a vertical dashed line. The fit residuals in magnitudes are displayed in the lower panel.
Current usage metrics show cumulative count of Article Views (full-text article views including HTML views, PDF and ePub downloads, according to the available data) and Abstracts Views on Vision4Press platform.
Data correspond to usage on the plateform after 2015. The current usage metrics is available 48-96 hours after online publication and is updated daily on week days.
Initial download of the metrics may take a while.