| Issue |
A&A
Volume 525, January 2011
|
|
|---|---|---|
| Article Number | A147 | |
| Number of page(s) | 11 | |
| Section | Interstellar and circumstellar matter | |
| DOI | https://doi.org/10.1051/0004-6361/200811428 | |
| Published online | 09 December 2010 | |
An intrinsic source of reddening in the cataclysmic variable SS Cygni⋆
1
Dpt. of Physics, Università La Sapienza,
Roma Piazzale A.Moro 5,
00185
Roma,
Italy
e-mail: franco.giovannelli@iasf-roma.inaf.it
2
INAF – Istituto di Astrofisica Spaziale e Fisica Cosmica, Roma,
Area di Ricerca CNR di Roma-2, via del Fosso del Cavaliere 100,
00133
Roma,
Italy
Received: 26 November 2008
Accepted: 8 September 2010
By using the INES archive of the IUE satellite, we analyzed the spectra of SS Cygni in quiescence in order to determine the value of the reddening of the binary system. The reddening of the system is reported in the literature with values that vary significantly from one another. The results demonstrate that the reddening is comprised by two components: the first, interstellar in origin, with a value E(B − V) = 0.04 ± 0.02 mag, and the second, intrinsic to the binary system, with values up to E(B − V) = 0.16 ± 0.02 mag. The intrinsic value of the reddening is variable along the quiescent phase and with orbital phase.
Key words: stars: dwarf novae / accretion, accretion disks / circumstellar matter / stars: individual: SS Cygni / ultraviolet: stars / astronomical data bases: miscellaneous
© ESO, 2010
1. Introduction
Cataclysmic variables (CVs) are binary systems in which the primary component is a white dwarf (Mwd ~ 1 M⊙) and the secondary is a late-type main-sequence star (Mopt < 1 M⊙). Depending on the magnetic field intensity at the white dwarf, the accretion of matter from the secondary star onto the primary can occur either via an accretion disk or a channeling through the magnetic poles or in an intermediate way. Usually the mass transfer rate is ranging from Ṁ ~ 10-11 to 10-8 M⊙ yr-1 (Patterson 1984; Smak 1985a). Cataclysmic variables have almost periodic flare-ups on a timescale of several weeks or years and with up to a few magnitudes in optical wavelengths; the duration of the outbursts is much shorter than the recurrence time.
A number of texts provide a comprehensive discussion of CV systems. Among them are Livio & Shaviv (1984), Hack & La Dous (1990, 1993), Warner (1995), Hellier (2001). Several older reviews also provide an in-depth discussion of CVs, including La Dous (1994) and Patterson (1994). For a more contemporary discussion, please see the recent review paper by Giovannelli (2008). In addition, we recommend the important reviews about the evolution of CVs and low mass X-ray binaries (LMXBs) by Patterson (1984, 1998) and Ritter (2008).
Historically, the classification of CVs was based on the optical outburst properties, by which one may distinguish four groups of CVs: (i) classical novae; (ii) recurrent novae; (iii) dwarf novae; (iv) nova-like objects (see, e.g., Robinson 1976; Cordova & Mason 1983). In this scheme of classification, SS Cyg ( ;
;  with the galactic coordinates l2000 = 090.5592, b2000 = − 07.1106), whose distance is 166.2 ± 12.7 pc (Harrison et al. 1999), is a dwarf nova and of those the brightest one. Its optical magnitude ranges from ~12 to ~8.5 during quiescent and outburst phases, respectively.
Because of these characteristics, it is the most observed CV, not only in the optical, where measurements are available from the end of the 19th century (see, e.g., Mattei et al. 1985, 1991) to the present, but also in other wavelength regions. However, the former classification is neither self-consistent nor adequate, and it is much better to consider the observed accretion behavior as a primary litmus (Smak 1985b). One obvious advantage of such an approach is connected with the time scales of various accretion phenomena, which are sufficiently short, so as to avoid any major observational bias: the mass accretion rates in CVs, as we already said, range from ~10-11 to 10-8 M⊙ yr-1; the time scales are from tens of seconds (oscillations in dwarf novae at outbursts) to years (for example, the super-outbursts of SU UMa stars or the long-term variations in VY Scl stars). SS Cygni shows oscillations of ~10 s both in optical and in X-ray ranges, orbital modulations (Porb ≃ 6.6 h) of the intensities of Balmer and UV emission lines and of the continuum, and almost periodic outbursts (Poutb ~ 50 days, Howarth 1978). All these characteristics together with the relative high luminosity both in outburst and in quiescence render SS Cygni the most appropriate laboratory for studying the physical processes occurring in dwarf novae and in CVs in general (see the review by Giovannelli & Martinez-Pais 1991).
However, despite the enormous amount of multifrequency experimental data spread over many years, the morphology and the nature of SS Cygni are still unsettled questions. Indeed, SS Cygni was classified as a non-magnetic CV (NMCV) by Bath & van Paradijs (1983). Ricketts et al. (1979) explained the X-ray emission from SS Cygni as owing to the radial inflow of matter onto a magnetized white dwarf (B ~ 106 G) from a disrupted accretion disk. Fabbiano et al. (1981), using optical-UV spectroscopy of SS Cygni, noted that its behavior is not compatible with a viscous disk model and confirmed the magnetic nature of the white dwarf with B ≤ 1.9 × 10⁶ G, by using coordinated X-ray measurements. Further multifrequency data of SS Cygni showed the incompatibility of its behavior with that of NMCV, and strongly favored its classification as that of an intermediate polar (see, e.g. Giovannelli et al. 1985; Giovannelli & Martinez-Pais 1991; Kjurkchieva et al. 1998; Marchev et al. 1999; Gaudenzi et al. 2002; Long et al. 2005; Schreiber et al. 2003; Schreiber & Lasota 2007).
Moreover, in SS Cyg, Lhard − X < LUV + soft − X. This is compatible with thermonuclear burning onto the WD surface. Thermonuclear burning was first suggested by Mitrofanov (1978). Gaudenzi et al. (2002) found that thermonuclear burning can occur in ~24% of the WDs surface. Recently, Kording et al. (2008) detected a radio jet from SS Cyg. The hardness intensity diagram shows an analogy between X-ray binaries (XRBs) and SS Cyg. Upper limits to linear and circular polarizations have been found as 3.2 ± 2.7% and −3.2 ± 2.7%, respectively.
INTEGRAL/IBIS and SWIFT/XRT observations have shown that a conspicuous number of CVs have a strong hard X-ray emission (Landi et al. 2009). In their published sample of 22 CVs, 21 are classified as magnetic CVs (MCVs) (intermediate polar: IP) and only one (SS Cyg) as NMCV, meanwhile all its characteristics are practically equal to those of the other 21 objects. This is one more strong circumstantial proof in favor of the magnetic nature of SS Cyg. Scaringi et al. (2010) reported the detection of one more IP: AO Psc, which is added to the former sample.
However, in the literature there are many papers that seem to contradict the intermediate polar nature of SS Cyg. Indeed, Gnedin et al. (1995) found from observations of intrinsic circular polarization in SS Cyg performed in the wings of the Balmer hydrogen lines that the true value of the magnetic field probably lies in the range 0.03 < B < 0.3 MG.
Mauche (1996) detected by using Extreme Ultraviolet Explorer satellite observations quasi-periodic oscillations (QPOs) from SS Cyg with a period in the range 7.19 − 9.3 s. This variation correlates with the extreme ultra-violet (EUV) flux as  . With a magnetospheric model to reproduce this variation, he found that a high-order, multipole field is required, and that the field strength at the surface of the white dwarf is 0.1 < B < 1 MG. This field strength is at the lower extreme of those measured or inferred for bona fide magnetic cataclysmic variables. However, they do not exclude the possibility that at an outburst the accretion of matter could occur onto the magnetic poles of the white dwarf.
With regard to this question, Mauche et al. (1997) discussed the case of UV line ratios of CVs, which seem to be almost independent of the nature (magnetic or not) of CVs. Okada et al. (2008) found from CHANDRA HETG (High Energy Transmission Grating) observations in SS Cyg that the spectrum in quiescence is dominated by H-like Kα lines, and is dominated in outburst by He-like lines, which are as intense as H-like lines. The broad line widths and line profiles indicate that the line-emitting plasma is associated with the Keplerian disk. In quiescence the lines are narrower and are emitted from an ionizing plasma at the entrance of the boundary layer. Ishida et al. (2009) found from SUZAKU observations of SS Cyg that the plasma temperature in quiescence is 20.4 keV and in outburst 6.0 keV. The 6.4 keV line is resolved in narrow and broad components, which indicates that both the white dwarf and accretion disk contribute to the reflection. The standard optically thin boundary layer is the most plausible picture of the plasma configuration in quiescence. The reflection in outburst originates from the accretion disk and an equatorial accretion belt. The broad 6,4 keV line suggests that the optically thin thermal plasma is distributed on the accretion disk, in a manner similar to that of a solar corona.
Long et al. (2005) found by fitting the double-peaked line profile in SS Cyg that the FUV line-forming region is concentrated closer to the white dwarf than the region that forms the optical lines. Their study provides no evidence of a hole in the inner disk.
The system SS Cygni is also important as laboratory for the study of circumstellar dust in CVs. Indeed, Jameson et al. (1987) detected IR emission from SS Cygni in outburst in the IRAS Bands I and II (11.8 μm and 24.4 μm). The most likely origin of the IR emission is circumstellar dust heated by the enhanced UV flux during outburst. Dubus et al. (2004) performed optical and mid-IR observations of several CVs including SS Cygni in quiescence. For SS Cygni the measurements at 11.8 μm are consistent with the upper limits obtained by Jameson et al. (1987) when the source was not yet in full outburst. The observed variability in the mid-IR flux on short time scales is hardly reconcilable with intrinsic or reprocessed emission from circumbinary disk material, while on the contrary a free-free emission from a wind should be. If any sizeable circum-binary disk is present in the system, it must be self-shadowed or perhaps dust free, with the peak thermal emission shifted to far-IR wavelengths.
The orbital parameters of the binary system were derived by Giovannelli et al. (1983) by using theoretical and experimental constraints from measurements obtained in different energy regions. They are i = 40° ,
,  ,
,  ,
,  , Rod = 2.9 × 1010 cm, Rid = 3.6 × 109 cm, where 1 and 2 refers to the primary and secondary star, respectively. Rod and Rid are the outer and inner accretion disk radius. These parameters have been confirmed by direct measurements of radial velocities (Martinez-Pais et al. 1994). Martinez-Pais et al. determined also that the optical companion of SS Cygni system is a K2–K3 late-type star.
The galactic reddening in the direction of SS Cyg is 0.512 mag (NED catalog; Schlegel et al. 1998), but it is irrelevant for SS Cyg and nearby objects because they are a few hundreds of parsecs distant.
The determination of E(B − V) has been always very difficult and the results obtained in the literature range from 0.04 ± 0.03 mag (Verbunt 1987; La Dous 1991), to 0.07 mag (Bruch & Engel 1994), to 0.08 ± 0.08 mag (Holm & Gallagher 1974), to 0.11 ± 0.02 mag (Giovannelli et al. 1984), which is an average value determined by using two dozens of spectra available at that time. The latter value completely agrees with that determined by Zuckerman (1961). Kiplinger (1979) determined a value E(B − V) = 0.13 ± 0.03 mag from his optical spectrophotometric observations during a quiescent phase, integrated with UV (Wu 1976) and IR data (Szkody 1977).
Wallerstein (1963) briefly discussed the absolute magnitude and reddening of SS Cyg. He performed a comparison of the strengths of the interstellar lines in SS Cyg with those in the spectra of stars in the same part of the sky, and concluded that the reddening of the stars in that region is small (0.0 ≤ E(B − V) ≤ 0.06 mag) and that it is likely that SS Cyg is unreddened.
A natural question arises from this. Why are the values of E(B − V) so different? Could a physical reason exist for these differences? We suggest that it is possible that the reddening depends both on a constant, interstellar component, and on another element intrinsic to the binary system. It is this element which is variable. The test of this hypothesis is the principal reason for this paper.
We have therefore re-analyzed all the IUE spectra of SS Cygni in order to investigate the behavior of the reddening.
We present here the results of the analysis of the UV spectra of SS Cygni in quiescence with data from the IUE archive. We used all short wavelength (SW) and long wavelength (LW) spectra for which the short-long wavelength junction was possible.
Our results show a variable reddening of the system when the quiescent phase is developing.
2. Journal of observations
Table 1 reports the journal of observations that were performed with the IUE observatory by several groups including our own. The data are now available in the INES archive.
Columns report 1) progressive numbers; 2) the image number; 3) the heliocentric Julian day (HJD); 4) the orbital phase computed using the ephemeris of Feldt & Chincarini (1980); 5) the exposure time texp; 6) t% which is the time elapsed since the end of the preceding outburst expressed in percent of the duration of the quiescent phase; 7) number (nx, x = a,b,c) corresponding to the quiescence during which spectra were obtained (see Fig. 1).
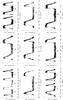 |
Fig. 1 Optical light curves of SS Cygni in the epochs of the IUE measurements used in this paper (Mattei et al. 1985, 1991). |
3. Data analysis
All quiescent spectra acquired with the large slit have been considered for this analysis. Information on the optical state of SS Cygni was provided by the American Association of Variable Stars Observers (AAVSO). The light curves for the periods of interest are shown in Fig. 1.
In order to evaluate the initial ti and final tf times of a quiescence by utilizing the data from the light curves, we performed a linear fit for
-
1.
the declining phase data of the preceding outburst;
-
2.
the quiescence phase data;
-
3.
the arising data of the following outburst.
We derived ti and tf by determining the two intersection points between the first and second linear fit ti and between the second and the third one tf. The quiescence length is then given by  (1)For the scope of this work, it is helpful to utilize the time elapsed from the end of the preceding outburst as percentage of the whole quiescence period:
 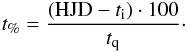 (2)
(2)
4. Results
In order to evaluate the reddening of the system we used the whole INES archive spectra for which a short-long wavelength junction was possible. The name of each pair is formed by long-short (LS) and four digits: the first two and the last two refer to the last digits of the long wavelength (LW) and short wavelength (SW) spectra, respectively.
Table 2 reports these pairs of spectra together with the results (see below).
Two independent methods were used to determine the value of the reddening E(B − V) by filling the 2175 Å absorption bump (Seaton 1979; Fitzpatrick & Massa 1986, 1988):
-
1.
after the determination of the continuum from 1250 to3250 Å, we applied nine successivedifferent values of E(B − V), from 0.04 to 0.20 mag with steps of 0.02 mag to find the value corresponding to the best de-bumping;
-
2.
in the second case an automatic procedure was used to trace a continuum between 1795 Å and 3080 Å and to evaluate the root mean square (rms) between the intensity values of the absorption feature (1970 − 2500 Å) and the corresponding continuum values: the E(B − V) value minimizing the rms has been chosen for the reddening evaluation.
A comparison between the results obtained by the two methods allowed us to solve the few remaining uncertain cases and to refine the determination of the uncertainty to be associated to E(B − V). These results are reported in Table 2 and are shown in Figs. 2 to 6. It is evident that E(B − V) shows different values varying t% and orbital phase (Φ).
Figure 2 shows E(B − V) vs. t% for a quiescent phase between a short outburst (S) and a long outburst (L):
-
at the beginning of the quiescence we find the minimum value forthe correction, that is 0.04 mag;
-
during the quiescence, the E(B − V) values range from the minimum of 0.04 mag to a maximum of 0.16 mag. The higher values are roughly concentrated between t% ~ 30 and t% ~ 70.
Unfortunately, not all regions of quiescence are covered by experimental data.
Figure 3 shows that from about the half and the end of a quiescence between a long or long(anomalous) outburst (L or L(A)) and a short outburst (S), E(B − V) decays from a maximum of ~0.16 mag to a minimum of ~0.06 mag. Unfortunately data in the first half of the quiescence are not available. However, collecting the available data all together, independently of the kind of quiescence, as shown in Fig. 4, an increasing of the reddening in the first half of the quiescence from the minimum of ~0.04 mag to the maximum of ~0.16 mag is evident, with the exception of two data. In the second half of the quiescence, E(B − V) decreases until the minimum value.
Figures 5 and 6 show the E(B − V) behavior as a function of the orbital phase. Figure 6 shows evidence of the presence of a modulation of the data following a long and/or long anomalous outburst, while no definite conclusion can be inferred concerning the phase-dependent behavior after a short outburst, as shown in Fig. 5.
Figure 7 shows the contour of E(B − V) in the Φ − t% plane. Evidently the maximum value of E(B − V) = 0.16 mag is at about 70 ≤ t% ≤ 80 and 0.5 ≤ Φ ≤ 0.6. However, it is important to note that the enhancement of E(B − V) starts at Φ ~ 0.2, where its value is the minimum (0.04 mag), growing until its maximum and then decreasing again before ending at Φ ~ 0.9, where its value is again the minimum. The growing of E(B − V), along the quiescent phase starts at about t% ~ 30, reaching the maximum at about 70 − 80 and then decreasing again until the next outburst. In other words, soon after the end of an outburst, the reddening is at the minimum value. This indicates that no opaque material is present in the system, and that this material forms during the days following the outburst.
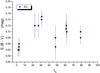 |
Fig. 2 E(B − V) values versus t% for spectra belonging to a quiescence between a short and a long outburst. |
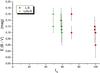 |
Fig. 3 E(B − V) values versus t% for spectra belonging to a quiescence between a long/long(anomalous) and a short outburst. |
We have performed a t-student hypothesis test on the E(B − V) values in order to check the statistical significance of their variations. The selected hypothesis is the following:  mag, this value being the minimum obtained from our data and also reported once in the literature (Verbunt 1987). The test indicates that the probability for having values E(B − V) > 0.04 mag is 99.95%. This means that the values higher than the minimum (0.04 mag) are caused by an additional variable component intrinsic to the system itself.
5. Discussion
5.1. Fullerenes
It is reasonable to ask what sort of candidate material we hypothesize for this additional variable component, intrinsic to the system itself, in the 2175 Å region.
As shown by Iglesias-Groth (2004) fullerenes and buckyonions are the best candidates to explain the shape, width and peak energy of the most prominent feature of the UV 2175 Å bump. Concerning the diffuse interstellar medium (ISM), the positions and widths observed for the 2175 Å bump can be explained by the power-law-size distribution proposed by Iglesias-Groth (2004). In her calculations of the density of fullerenes and buckyonions, she uses a comparison between the theoretical cross-sections of her model and the UV bump data. In addition, some studies are available in the literature confirming the formation of fullerenes and buckyonions in the laboratory (Kuznetsov et al. 1994; Ugarte 1995) and in the circumstellar envelopes of evolved stars and other astrophysical environments (see, e.g., Kroto et al. 1987; Kroto 1997; and Draine 2009). It is therefore reasonable to suggest that fullerenes and buckyonions form and destroy inside the SS Cyg system during quiescence, thus contributing to the observed effect of a variable reddening. It should also be possible that fullerenes and buckyonions are accreted and/or ejected during outbursts.
 |
Fig. 4 E(B − V) values versus t% for all spectra. |
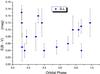 |
Fig. 5 E(B − V) values versus the orbital phase only for the spectra belonging to a quiescence between a short and a long outburst. |
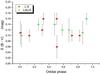 |
Fig. 6 E(B − V) values versus the orbital phase only for the spectra belonging to a quiescence between a long/long(anomalous) and a short outburst. |
Indeed Iglesias-Groth (2004) discussed a model of the photoabsorption spectra of fullerenes and buckyonions in order to ascertain their presence in space by comparison with the observed features of interstellar extinction. The photoabsorption cross sections of individual and multishell fullerenes obtained by her model resemble the UV bump at 2175 Å (5.7 eV). Comparison between the theoretical cross-sections and the UV bump data allows an estimate of the density of fullerenes and buckyonions in the diffuse ISM. In particular, the power law size distribution obtained can explain the positions and widths observed for the 2175 Å bump. The densities inferred for small fullerenes and buckyonions is 0.2 and 0.1 ppm, respectively. Similar densities have been observed in meteorites at ~0.1 ppm. With a mixture of ~80 carbons per million hydrogen atoms, and the hypothesis that the cosmic carbon abundance is close to the solar atmosphere value, individual fullerenes may comprise 20% − 25% of the total carbon in diffuse interstellar space.
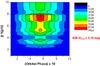 |
Fig. 7 E(B − V) contour in the Φ − t% plane. The maximum value E(B − V)max = 0.16 mag corresponds to 100% of E(B − V) depicted in red. |
We propose that fullerenes and buckyonions are a reasonable source of the additional, intrinsic components in SS Cygni.
Indeed, from the point of view of the physical conditions similar to those present in stellar environments, it has been shown in the laboratory that
-
the grafitization and growth of fullerenes have been observed byUgarte (1992) under strong electronic irradiation, conditionsthat can partially simulate those present in stellar environments;
-
a strong gradient in temperature can favor the formation of fullerenes (Saidane et al. 2004);
-
the formation of fullerenes has been observed under the most diverse conditions of pressure (~3−105 Pa) (Saidane et al. 2004; Kroto et al. 1985);
-
the other allotropic forms of C aggregate in normal conditions, for temperatures on the order of 1100−3000 °C (Ugarte 1995), and fullerenes can grow, starting on graphite and diamond seed crystals (Ugarte 1995; Tomita et al. 2004);
-
in different laboratory experiments (Praburam & Goree 1995; Saidane et al. 2004) fullerenes accreted from carbon soot for a temperature of ~300−4000 K in vapors of inert gases (He, Ar).
From the point of view of the chemical composition, the most probable stellar candidates seem to be hydrogen-poor stars, or, better, carbon-rich systems. But these types of stars do not show a strong 2175 Å peak. It has been verified in laboratory experiments that an excess of carbon or oxygen content in a gas mixture inhibits diamond formation, which can be precursors of fullerene growth (Ugarte 1995). Moreover Kroto et al. (1987) showed that in complex environments, high temperatures favor the formation of carbon/carbon bonds relative to carbon/hydrogen bonds because of the large difference in bond energies.
5.2. Interstellar and intrinsic components of the reddening
The results obtained from our re-analysis of the data presented here demonstrate the existence of two components of the reddening: an interstellar component that remains constant and equal to 0.04 mag and an intrinsic component, owing to concentration of matter inside the system itself. This intrinsic component is responsible for both the observed modulations with the orbital phase and for the variations during the quiescent phase. The modulation with orbital phase is caused by simply the change in orientation of the observer to the system, while the variations of the reddening with t% can be owing to a dynamic process of formation, evanescence, and escape or accretion of absorbing material.
In particular, the observed E(B − V) behaviour as a function of t% (see Fig. 4) indicates that immediately after the outburst the contribution of the intrinsic component is equal to zero because of a higher value of delivered radiation pressure sweeping it away. Increasing t% between 0 and ~50, the E(B − V) value also increases, which indicates accreting diffuse matter inside the system. Part of this matter can convert itself in fullerenes on a time scale much shorter than the duration of the quiescence. Then, the E(B − V) value decreases: this could be compatible with an escape from the system of the accumulated matter for reasons that we have discussed previously. These speculations on the escape, evanescence, or accretion of the absorbing material must be regarded as preliminary.
6. Conclusions
Concerning the present study on E(B − V) in SS Cygni, some important considerations must be taken into account with respect to the others available in literature:
-
We have utilized two independent methods and a significancetest for fitting the 2175 Å bump anddetermining the E(B − V) value for each of the 31 spectral samples obtained from the IUE archive.
-
Some studies (Iglesias-Groth 2004) demonstrate that fullerenes and buckyonions are the best candidates for explaining the shape, width and peak energy of the most prominent feature of the 2175 Å bump.
-
Other studies (Kuznetsov et al. 1994; Ugarte 1995; Kroto et al. 1987; Kroto 1997; Draine 2009) demonstrate that the formation of fullerenes and buckyonions is confirmed both in laboratory and in circumstellar envelopes of evolved stars and other astrophysical environments.
-
The very high obtained significance value of 99.95%, confirming the hypothesis for having E(B − V) > 0.04 mag, points out the necessity of investigating the reason of this variation taking into account the fullerenes hypothesis rather than that of the hydrogen column density.
-
Indeed, following the formula of Bohlin et al. (1978) – which however has been derived for early-type stars with distances much greater than that of SS Cygni – we have derived the values of E(B − V) for SS Cyg by using hydrogen column densities evaluated by SUZAKU (8.2 × 1019 cm-2 – Ishida et al. 2009), CHANDRA (5.0 × 1019 cm-2 – Mauche 2004), EUVE (4.4 × 1019 cm-2 – Mauche et al. 1995), ASCA ( < 3 × 1019 cm-2 – Baskill et al. 2005) which give for E(B − V) the values 0.014, 0.009, 0.008, and 0.005 mag, respectively. However, all these values of NH reported in the aforementioned papers are model-dependent. Then, our minimum value of E(B − V) = 0.04 mag is about four times higher than the maximum reddening owing to hydrogen column density (0.014 mag). This means that the remnant reddening is caused by carbon (Iglesias-Groth 2004). Our E(B − V) reaches the value of 0.16 mag; this means that there is an additional local component of dust. This confirms Iglesias-Groth’s hypothesis concerning the fullerenes (C) as responsible for the UV 2175 Å bump.
Therefore, the reddening values obtained from our data allow us to argue that
-
1.
the reddening of the cataclysmic variableSS Cygni, during quiescence, is variable both withthe time elapsed from the preceding outburst and with the orbitalphase. It consists of two components:
-
the first component is interstellar in origin and is constant.The value of the correction for such a minimum reddening isE(B − V) = 0.04 mag;
-
the second component is intrinsic to the system and is variable in time. The maximum value of E(B − V) = 0.16 mag is at about 70 ≤ t% ≤ 80 and 0.5 ≤ Φ ≤ 0.6 (see Fig. 7). However, note that the enhancement of E(B − V) starts at Φ ~ 0.2, where its value is the minimum (0.04 mag), growing until the maximum and decreasing again until it ends at Φ ~ 0.9, where its value is again the minimum. And the growing of E(B − V), along the quiescent phase, starts at about t% ~ 30 for reaching the maximum at about 70 − 80 and then decreasing again until the next outburst. In other words, soon after the end of an outburst the reddening is at the minimum value; this indicates that no opaque material is present in the system, which on the contrary forms during the following days after the outburst.
-
-
2.
the physical and chemical parameters of the system are consistent with the possibility of formation of fullerenes. The presence of a variable component of the reddening growing in the first half of the quiescence is compatible with the formation of fullerenes by conversion of matter inside the binary system. In the second half, the decreasing value of E(B − V) could be compatible with an escape from the system of the accumulated matter.
We therefore believe that we have answered the question that triggered this paper: why are the values of E(B − V) available in the literature for SS Cyg so different? Indeed, two components of the reddening of SS Cyg emerge from our analysis: the first is interstellar in origin, and the second (intrinsic to the system itself) is variable and changes during the evolution of a quiescent phase. Moreover, an orbital modulation also exists.
A possible model explaining the modulations owing to orbital phase is beyond the scope of this paper.
More investigations in other CVs are desirable in order to test the general validity of our results. Measurements in sub-mm and mm bands are crucial for such a test. The ALMA ground-based experiment (0.3 − 16.7 mm) (see Wootten 2008) and the future space-based experiment, MILLIMETRON (0.02 − 20 mm) (Kardashev & Novikov 2010) will help to determine the question raised here about the extent of the presence of dust in CVs.
Journal of observations.
Results.
Acknowledgments
Many thanks to Corinne Rossi of “La Sapienza” University in Roma for helpful discussions. We are grateful to the unknown referee for his important suggestions, which allowed us to improve the paper. We express our thanks to Jim Beall of St. John’s College and the Space Sciences Division of the Naval Research Laboratory for his assistance with a final draft of this paper. The authors MM, MC, and RL are grateful to the first author, Silvia Gaudenzi, for having worked – with FG’s help – on the revision of this paper in spite of her serious health problems. This research has made use of NASA’s Astrophysics Data System.
References
- Baskill, D. S., Wheatley, P. J., & Osborne, J. P. 2005, MNRAS, 357, 626 [NASA ADS] [CrossRef] [Google Scholar]
- Bath, G. T., & van Paradijs, J. 1983, Nature, 305, 33 [NASA ADS] [CrossRef] [Google Scholar]
- Bohlin, R. C., Savage, B. D., & Drake, J. F. 1978, ApJ, 224, 132 [NASA ADS] [CrossRef] [Google Scholar]
- Bruch, A., & Engel, A. 1994, A&AS, 104, 79 [NASA ADS] [Google Scholar]
- Cordova, F. A., & Mason, K. O. 1983, in Accretion Driven Stellar X-Rays Sources, ed. W. H. G. Lewin, & E. D. J. van den Heuvel (Cambridge: Cambridge University Press), 147 [Google Scholar]
- Draine, B. T. 2009, in Cosmic Dust - Near and Far, ed. T. Henning, E. Grün, & J. Steinacker, ASP Conf. Ser., 414, 453 [Google Scholar]
- Dubus, G., Campbell, R., Kern, B., Taam, R. E., & Spruit, H. C. 2004, MNRAS, 349, 869 [NASA ADS] [CrossRef] [Google Scholar]
- Fabbiano, G., Hartmann, L., Raymond, J., et al. 1981, ApJ, 243, 911 [NASA ADS] [CrossRef] [Google Scholar]
- Feldt, A. N., & Chincarini, G. 1980, PASP, 92, 528 [NASA ADS] [CrossRef] [Google Scholar]
- Fitzpatrick, E. L., & Massa, D. 1986, ApJ, 307, 286 [Google Scholar]
- Fitzpatrick, E. L., & Massa, D. 1988, ApJ, 328, 734 [NASA ADS] [CrossRef] [Google Scholar]
- Gaudenzi, S., Claudi, R. U., Giovannelli, F., et al. 2002, in Multifrequency Behaviour of High Energy Cosmic Sources, ed. F. Giovannelli, & L. Sabau-Graziati, Mem. SAIt., 73, 213 [Google Scholar]
- Giovannelli, F. 2008, ChJA&A Suppl., 8, 237 [Google Scholar]
- Giovannelli, F., & Martinez-Pais, I. G. 1991, SSRv, 56, 313 [NASA ADS] [Google Scholar]
- Giovannelli, F., Gaudenzi, S., Rossi, C., & Piccioni, A. 1983, AcA, 33, 319 [Google Scholar]
- Giovannelli, F., Bartolini, C., Candy, P., et al. 1984, in Proc. of the Fourth European IUE Conf., ed. E. Rolfe, ESA SP, 218, 391 [NASA ADS] [Google Scholar]
- Giovannelli, F., Gaudenzi, S., Lombardi, R., et al. 1985, in Multifrequency Behaviour of Galactic Accreting Sources, ed. F. Giovannelli, SIDEREA, Roma, Italy, 37 [Google Scholar]
- Gnedin, Yu. N., Natsvlishvili, T. M., Shtol’, V. G., Valyavin, G. G., & Shakhovskoi, N. M. 1995, Sov. AstL, 21, 118 [NASA ADS] [Google Scholar]
- Hack, M., & La Dous, C. 1990, Cataclysmic Variables and Related Objects, NASA/CNRS Monograph Series on Non Thermal Phenomena in Stellar Atmospheres [Google Scholar]
- Hack, M., & La Dous, C. 1993, Cataclysmic Variables and Related Objects, ASSL, 101, 1 [NASA ADS] [Google Scholar]
- Harrison, T. E., McNamara, B. J., Szkody, P., et al. 1999, ApJ, 515, L93 [NASA ADS] [CrossRef] [Google Scholar]
- Hellier, C. 2001, Cataclysmic Variable Stars (Springer) [Google Scholar]
- Holm, A. V., & Gallagher, J. S. 1974, ApJ, 192, 425 [NASA ADS] [CrossRef] [Google Scholar]
- Howarth, I. D. 1978, JBAS, 88, 458 [Google Scholar]
- Iglesias-Groth, S. 2004, ApJ, 608, L37 [NASA ADS] [CrossRef] [Google Scholar]
- Ishida, M., Okada, S., Hayashi, T., Nakamura, R., & Terada, Y. 2009, PASJ, 61, S77 [NASA ADS] [Google Scholar]
- Jameson, R. F., King, A. R., Bode, M. F., & Evans, A. 1987, The Observatory, 107, 72 [NASA ADS] [Google Scholar]
- Kardashev, N. S., & Novikov, I. D. 2010, talk at the I.M.C. Workshop 2010: Science with Millimetron, Palermo, Italy, 14th−18th June 2010 [Google Scholar]
- Kiplinger, A. L. 1979, AJ, 84, 655 [NASA ADS] [CrossRef] [Google Scholar]
- Kjurkchieva, D., Marchev, D., & Ogloza, W. 1998, Ap&SS, 262, 53 [NASA ADS] [CrossRef] [Google Scholar]
- Körding, E., Rupen, M., Knigge, C., Fender, R., & Dhawan, V. 2008, Science, 320, 1318 [NASA ADS] [CrossRef] [PubMed] [Google Scholar]
- Kroto, H. 1997, RvMP, 69, 703 [NASA ADS] [Google Scholar]
- Kroto, H. W., Heath, J. R., O’Brien, S. C., Curl, R. F., & Smaey, R. E. 1985, Nature, 318, 162 [NASA ADS] [CrossRef] [Google Scholar]
- Kroto, H. W., Heath, J. R., O’Brien, S. C., Curl, R. F., & Smaey, R. E. 1987, ApJ, 314, 352 [NASA ADS] [CrossRef] [Google Scholar]
- Kuznetsov, V. L., Chuvilin, A. L., Butenko, Y. V., Mal’kov, I. Y., & Titov, V. M. 1994, Chem. Phys. Lett., 222, 343 [NASA ADS] [CrossRef] [Google Scholar]
- La Dous, C. 1991, A&A, 252, 100 [NASA ADS] [Google Scholar]
- La Dous, C. 1994, SSRv, 67, 1 [Google Scholar]
- Landi, R., Bassani, L., Dean, J., Bird, J., & Fiocchi, M. 2009, MNRAS, 392, 630 [Google Scholar]
- Livio, M., Shaviv, G. 1984, Cataclysmic Variables and Related Objects, Haifa, Israel, August 9 − 13, 1982, Association of Univ. for Research in Astronomy, IAU Coll., 072 [Google Scholar]
- Long, K. S., Froning, C. S., Knigge, C., et al. 2005, ApJ, 630, 511 [NASA ADS] [CrossRef] [Google Scholar]
- Marchev, D., Kjurkchieva, D., & Ogłoza, W. 1999, AcA, 49, 585 [NASA ADS] [Google Scholar]
- Martinez-Pais, I. G., Giovannelli, F., Rossi, C., & Gaudenzi, S. 1994, A&A, 291, 455 [NASA ADS] [Google Scholar]
- Mattei, J. A., Saladyga, M., & Waagen, E. O. 1985, AAVSO Monograph (Cambridge, MA, USA: American Association of Variable Star Observers (AAVSO)) [Google Scholar]
- Mattei, J. A., Waagen, E. O., & Foster, E. G. 1991, AAVSO Monogr. (Cambridge, MA, USA: American Association of Variable Star Observers (AAVSO)), 1 [Google Scholar]
- Mauche, C. W. 1996, ApJ, 463, L87 [NASA ADS] [CrossRef] [Google Scholar]
- Mauche, C. W. 2004, ApJ, 610, 422 [NASA ADS] [CrossRef] [Google Scholar]
- Mauche, C. W., Raymond, J. C., & Mattei, J. A. 1995, ApJ, 446, 842 [NASA ADS] [CrossRef] [Google Scholar]
- Mauche, C. W., Lee, Y. P., & Kallman, T. R. 1997, ApJ. 477, 832 [Google Scholar]
- Mitrofanov, I. 1978, Sov. AstL, 4, 119 [NASA ADS] [Google Scholar]
- NED Catalog: http://nedwww.ipac.caltech.edu/ [Google Scholar]
- Okada, S., Nakamura, R., & Ishida, M. 2008, ApJ, 680, 695 [NASA ADS] [CrossRef] [Google Scholar]
- Patterson, J. 1984, ApJS, 54, 443 [NASA ADS] [CrossRef] [Google Scholar]
- Patterson, J. 1994, PASP, 106, 209 [NASA ADS] [CrossRef] [Google Scholar]
- Patterson, J. 1998, PASP, 110, 1132 [NASA ADS] [CrossRef] [Google Scholar]
- Praburam, G., & Goree, J. 1995, ApJ, 441, 830 [NASA ADS] [CrossRef] [Google Scholar]
- Ricketts, M. J., King, A. R., & Raine, D. J. 1979, MNRAS, 186, 233 [NASA ADS] [Google Scholar]
- Ritter, H. 2008 [arXiv:astro-ph/0809.1800v1] [Google Scholar]
- Robinson, E. L. 1976, ARA&A, 14, 119 [NASA ADS] [CrossRef] [Google Scholar]
- Saidane, K., Razafinimanana, M., Lange, H., et al. 2004, J. Phys. D: Appl. Phys., 37, 232 [NASA ADS] [CrossRef] [Google Scholar]
- Scaringi, S., Bird, A. J., Norton, A. J., Knigge, C., & Hill, A. B. 2010, MNRAS, 401, 2207 [NASA ADS] [CrossRef] [Google Scholar]
- Schlegel, D. J., Finkbeiner, D. P., & Davis, M. 1998, ApJ, 500, 525 [NASA ADS] [CrossRef] [Google Scholar]
- Schreiber, M. R., Hameury, J.-M., & Lasota, J.-P. 2003, A&A, 410, 239 [NASA ADS] [CrossRef] [EDP Sciences] [Google Scholar]
- Schreiber, M. R., & Lasota, J.-P. 2007, A&A, 473, 897 [NASA ADS] [CrossRef] [EDP Sciences] [Google Scholar]
- Seaton, M. J. 1979, MNRAS, 187, 73 [Google Scholar]
- Smak, J. 1985a, in Multifrequency Behaviour of Galactic Accreting Sources, ed. F. Giovannelli, SIDEREA, Roma, Italy, 17 [Google Scholar]
- Smak, J. 1985b, in Multifrequency Behaviour of Galactic Accreting Sources, ed. F. Giovannelli, SIDEREA, Roma, Italy, 3 [Google Scholar]
- Szkody, P. 1977, ApJ, 217, 140 [NASA ADS] [CrossRef] [Google Scholar]
- Tomita, S., Fujii, M., & Hayashi, S. 2004, ApJ, 609, 220 [NASA ADS] [CrossRef] [Google Scholar]
- Ugarte, D. 1992, Nature, 359, 707 [NASA ADS] [CrossRef] [PubMed] [Google Scholar]
- Ugarte, D. 1995, ApJ, 443, L85 [NASA ADS] [CrossRef] [Google Scholar]
- Verbunt, F. 1987, A&AS, 71, 339 [Google Scholar]
- Wallerstein, G. 1963, ApJ, 137, 991 [NASA ADS] [CrossRef] [Google Scholar]
- Warner, B. 1995, Cataclysmic Variable Stars, Cambridge Astrophysics Series (Cambridge University Press) [Google Scholar]
- Wootten, A. 2008, ApSS, 313, 9 [Google Scholar]
- Wu, C.-C. 1976, in Structure and Evolution of Close Binary Systems, ed. P. Eggleton, S. Mitton, & J. Whelan (Dordrecht: D. Reidel Publishing Co.), IAU Symp., 73, 213 [Google Scholar]
- Zuckerman, M.-C. 1961, Ann. Astrophys., 6, 431 [Google Scholar]
All Tables
All Figures
|
Fig. 1 Optical light curves of SS Cygni in the epochs of the IUE measurements used in this paper (Mattei et al. 1985, 1991). |
| In the text | |
|
Fig. 2 E(B − V) values versus t% for spectra belonging to a quiescence between a short and a long outburst. |
| In the text | |
|
Fig. 3 E(B − V) values versus t% for spectra belonging to a quiescence between a long/long(anomalous) and a short outburst. |
| In the text | |
|
Fig. 4 E(B − V) values versus t% for all spectra. |
| In the text | |
|
Fig. 5 E(B − V) values versus the orbital phase only for the spectra belonging to a quiescence between a short and a long outburst. |
| In the text | |
|
Fig. 6 E(B − V) values versus the orbital phase only for the spectra belonging to a quiescence between a long/long(anomalous) and a short outburst. |
| In the text | |
|
Fig. 7 E(B − V) contour in the Φ − t% plane. The maximum value E(B − V)max = 0.16 mag corresponds to 100% of E(B − V) depicted in red. |
| In the text | |
Current usage metrics show cumulative count of Article Views (full-text article views including HTML views, PDF and ePub downloads, according to the available data) and Abstracts Views on Vision4Press platform.
Data correspond to usage on the plateform after 2015. The current usage metrics is available 48-96 hours after online publication and is updated daily on week days.
Initial download of the metrics may take a while.