Fig. 3
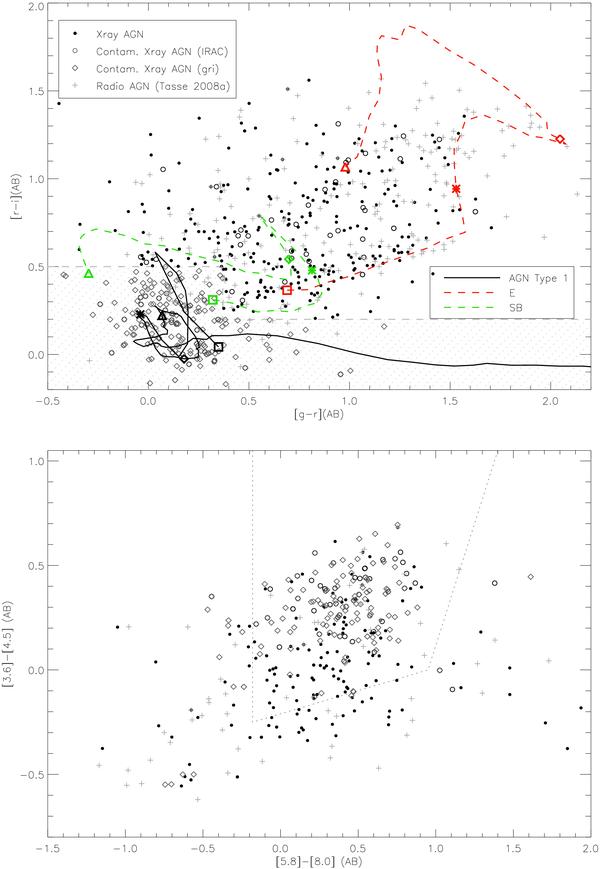
Top panel: the g′ − r′versus r′ − i′ colour–colour diagram for all the optical counterparts of X-ray sources (black dots, applying selection criteria SC1 and SC2 only6). Open circles indicate the optical counterparts of X-ray sources that have been classified as Type-1 AGN by the spectral fit criteria using the IRAC bands (SC6). The dashed area indicates the region corresponding to the optical g′ − r′versus r′ − i′ selection criteria used to reject the contaminating Type-1 AGN (SC5, grey diamonds). Radio source host galaxies (indicated by crosses) and X-ray optical counterparts clearly occupy different regions of this plot, with the radio-loud AGN more typically hosted by galaxies that do not show strong signs of AGN activity in the optical. We also plot the colour-colour tracks for a Type-1 QSO, an elliptical, and a starburst galaxy. The square, star, diamond and triangle symbols stand for redshifts 0, 0.5, 1.5, and 2 respectively. Bottom panel: the [3.6]–[4.5] versus [5.8]–[8.0] infrared colour–colour diagram. Stern et al. (2005) find ~90%of the broad-line AGN lying in the area delimited by the dotted line. Symbols are as in the top panel. The sources marked as open circles and diamonds have been rejected from our sample.
Current usage metrics show cumulative count of Article Views (full-text article views including HTML views, PDF and ePub downloads, according to the available data) and Abstracts Views on Vision4Press platform.
Data correspond to usage on the plateform after 2015. The current usage metrics is available 48-96 hours after online publication and is updated daily on week days.
Initial download of the metrics may take a while.