Fig. 11
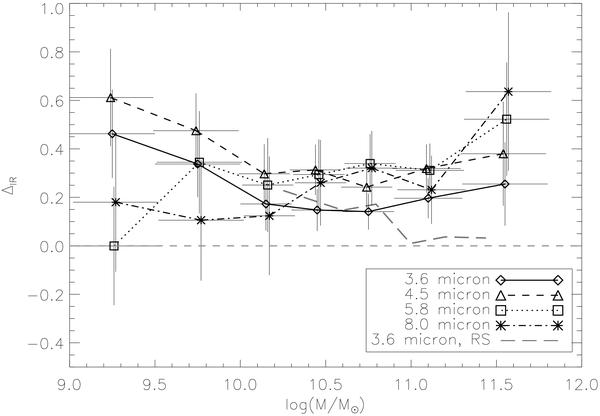
Following Tasse et al. (2008a) we have computed the infrared excess for the normal galaxies and for the host galaxies of X-ray selected AGN. This plot shows the difference in infrared excess between these two populations at fixed redshift and stellar mass. The X-ray selected AGN show a hot infrared excess, at short wavelengths all across the stellar mass range. For comparison we plot the infrared excess computed in a similar way for the radio selected AGN (dashed line, see Tasse et al. 2008a).
Current usage metrics show cumulative count of Article Views (full-text article views including HTML views, PDF and ePub downloads, according to the available data) and Abstracts Views on Vision4Press platform.
Data correspond to usage on the plateform after 2015. The current usage metrics is available 48-96 hours after online publication and is updated daily on week days.
Initial download of the metrics may take a while.