Fig. A.1
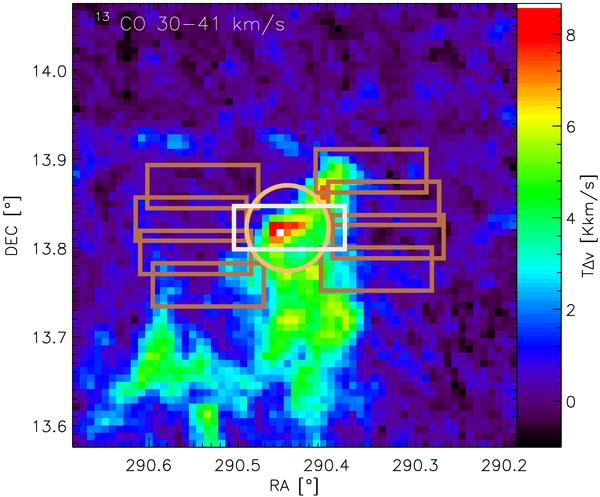
Map of the large-scale emission as measured by the 13CO 1–0 line. The map covered by [C i] observations is shown as gray rectangle in the centre, the brown rectangles around that map indicate the locations of the OFF maps taken in the double beam-switch scheme at the different times and dates of the observations. The circle indicates the size of the KOSMA error beam at the [C i] frequency. The FCRAO error beam at the 13CO 1–0 frequency is smaller by a factor three and is not shown here.
Current usage metrics show cumulative count of Article Views (full-text article views including HTML views, PDF and ePub downloads, according to the available data) and Abstracts Views on Vision4Press platform.
Data correspond to usage on the plateform after 2015. The current usage metrics is available 48-96 hours after online publication and is updated daily on week days.
Initial download of the metrics may take a while.