Fig. 3
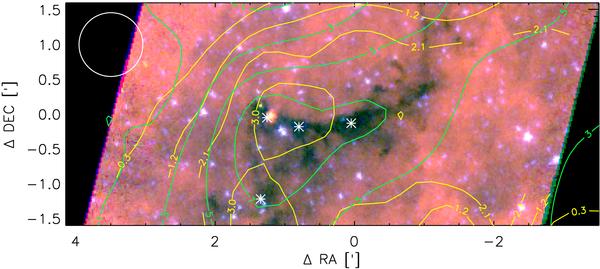
Integrated intensity contours in 13CO 1–0 (green) and in [C i]
 (yellow) on top of a Spitzer IRAC
false-colour image, composed of logarithmic intensities in the 8 μm
channel (red), the 5.8 μm channel (green), and the
3.6 μm channel (blue). The contours are labelled with intensities
[K km s-1] integrated from 30 to 41 km s-1. The positions of the
submm cores P1, P2, and EP (from west to east) identified by Ormel et al. (2005) and the southern 24 μm source
S2 from Van der Wiel & Shipman (2008) are
indicated by asterisks. The circle indicates the beam size of the [C i]
observations, the 13CO data are smoothed to the same resolution.
(yellow) on top of a Spitzer IRAC
false-colour image, composed of logarithmic intensities in the 8 μm
channel (red), the 5.8 μm channel (green), and the
3.6 μm channel (blue). The contours are labelled with intensities
[K km s-1] integrated from 30 to 41 km s-1. The positions of the
submm cores P1, P2, and EP (from west to east) identified by Ormel et al. (2005) and the southern 24 μm source
S2 from Van der Wiel & Shipman (2008) are
indicated by asterisks. The circle indicates the beam size of the [C i]
observations, the 13CO data are smoothed to the same resolution.
Current usage metrics show cumulative count of Article Views (full-text article views including HTML views, PDF and ePub downloads, according to the available data) and Abstracts Views on Vision4Press platform.
Data correspond to usage on the plateform after 2015. The current usage metrics is available 48-96 hours after online publication and is updated daily on week days.
Initial download of the metrics may take a while.