Free Access
Fig. 2
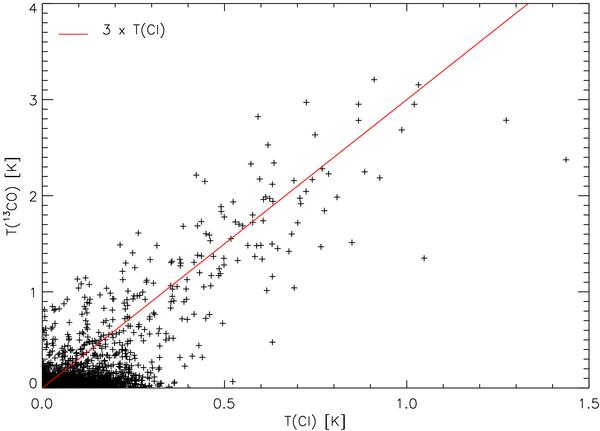
Scatter plot of the measured 13CO and [C i] intensities for different channels and points across the cloud. The red line indicates a [C i]/13CO intensity ratio of 1/3.
Current usage metrics show cumulative count of Article Views (full-text article views including HTML views, PDF and ePub downloads, according to the available data) and Abstracts Views on Vision4Press platform.
Data correspond to usage on the plateform after 2015. The current usage metrics is available 48-96 hours after online publication and is updated daily on week days.
Initial download of the metrics may take a while.