Fig. 1
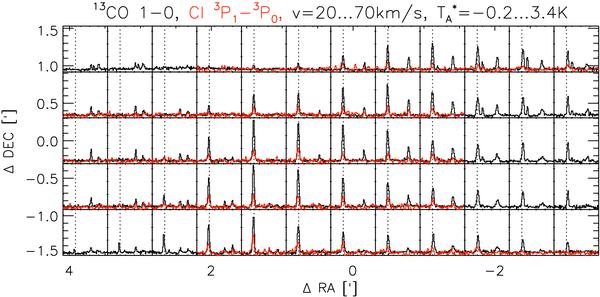
Line profiles measured on 13CO 1–0 (black, BU-FCRAO Galactic Ring Survey)
and in [C i]  (red, KOSMA) towards the IRDC
G48.65-0.29. All positions are given relative to the zero position of
19h21m44.7s, 13°49′31.7′′ (J2000). For each point
we show the spectrum covering the velocity range from 20 to 70 km s-1 and
an antenna temperature range from –0.2 to 3.4 K. The positions without [C i]
spectra were either not covered in the mapping or covered by a bad pixel providing a
noise level much higher than the line intensity. The dotted lines at
34 km s-1 mark the LSR velocity of the IRDC.
(red, KOSMA) towards the IRDC
G48.65-0.29. All positions are given relative to the zero position of
19h21m44.7s, 13°49′31.7′′ (J2000). For each point
we show the spectrum covering the velocity range from 20 to 70 km s-1 and
an antenna temperature range from –0.2 to 3.4 K. The positions without [C i]
spectra were either not covered in the mapping or covered by a bad pixel providing a
noise level much higher than the line intensity. The dotted lines at
34 km s-1 mark the LSR velocity of the IRDC.
Current usage metrics show cumulative count of Article Views (full-text article views including HTML views, PDF and ePub downloads, according to the available data) and Abstracts Views on Vision4Press platform.
Data correspond to usage on the plateform after 2015. The current usage metrics is available 48-96 hours after online publication and is updated daily on week days.
Initial download of the metrics may take a while.