Fig. 1
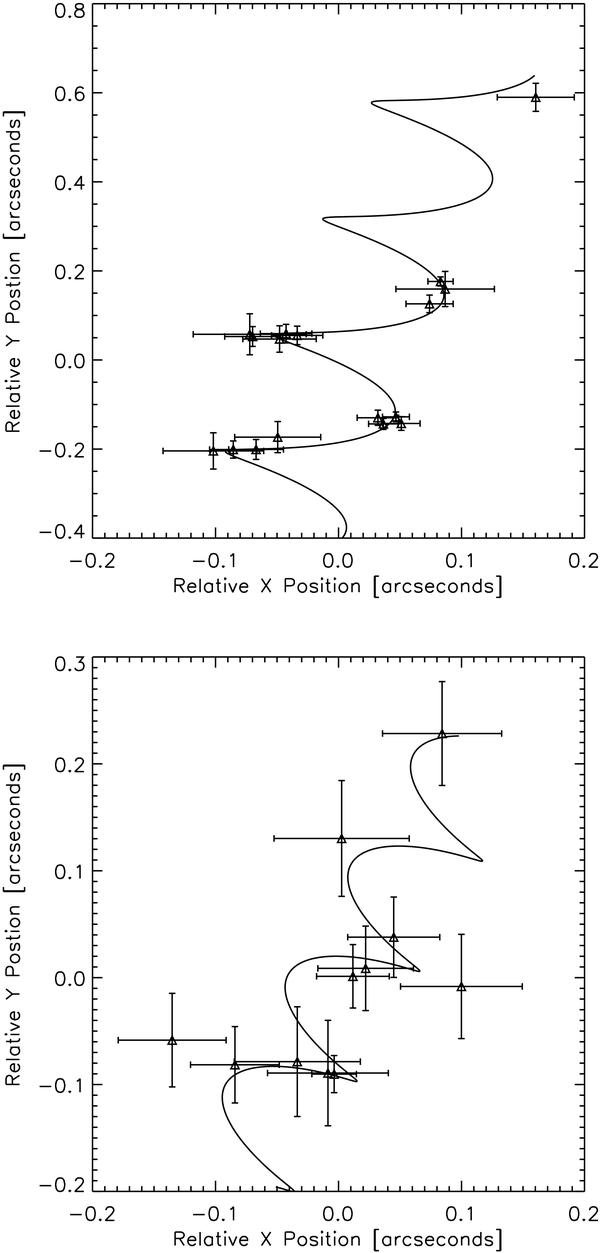
Observations for the targets ULAS 0901 (top panel) and 1315 (bottom panel). The highest point is the discovery image. The observational history and distance of these two targets are similar but they differ by a magnitude in apparent brightness. The solution shows the effect of low signal-to-noise observations in the beginning of the parallax sequence.
Current usage metrics show cumulative count of Article Views (full-text article views including HTML views, PDF and ePub downloads, according to the available data) and Abstracts Views on Vision4Press platform.
Data correspond to usage on the plateform after 2015. The current usage metrics is available 48-96 hours after online publication and is updated daily on week days.
Initial download of the metrics may take a while.