Fig. 3

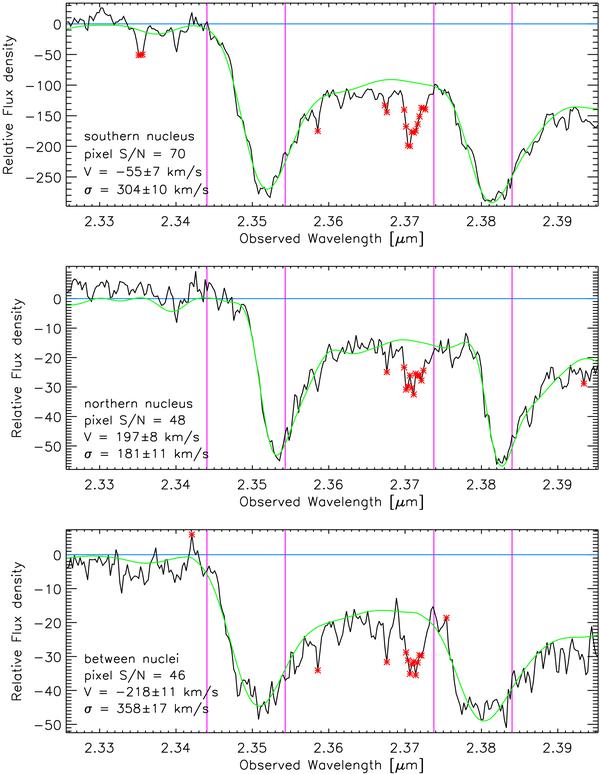
Spectra (black lines) and template fits (green lines) to the CO 2–0 and CO 3–1 stellar absorption features. These are for individual bins in the southern nucleus (top), the northern nucleus (middle) and in the region of high dispersion between them (bottom). The blue line indicates the continuum (i.e. zero) level; red asterisks denote pixels rejected during the fit; the pairs of magenta lines enclose regions around the bandheads for which the weighting is enhanced during the fit. These plots demonstrate the quality of the fit using our single M3 III template.
Current usage metrics show cumulative count of Article Views (full-text article views including HTML views, PDF and ePub downloads, according to the available data) and Abstracts Views on Vision4Press platform.
Data correspond to usage on the plateform after 2015. The current usage metrics is available 48-96 hours after online publication and is updated daily on week days.
Initial download of the metrics may take a while.


