Fig. 13
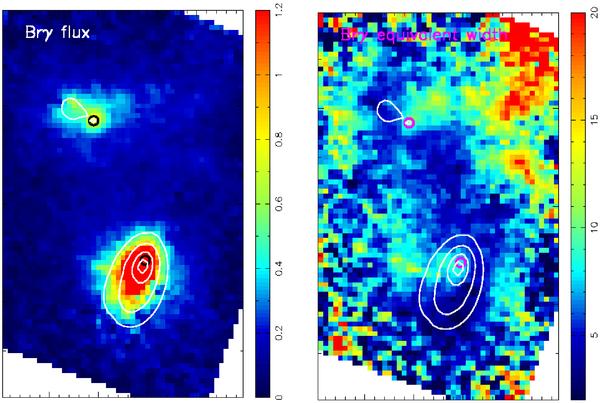
Left: map of Brγ flux (units given in 10-16 W m-2 μm). Right: map of WBrγ (units given in Å). White contours tracing the K-band stellar continuum, and black circles denoting the black hole locations are overdrawn on both maps. Although the most intense Brγ emission is on the nuclei, the equivalent width here is lowest, suggesting that the K-band light is dominated by an older stellar population. We note that in Sect. 4 we showed that dilution by hot dust emission associated with the AGN cannot play a role in reducing WBrγ.
Current usage metrics show cumulative count of Article Views (full-text article views including HTML views, PDF and ePub downloads, according to the available data) and Abstracts Views on Vision4Press platform.
Data correspond to usage on the plateform after 2015. The current usage metrics is available 48-96 hours after online publication and is updated daily on week days.
Initial download of the metrics may take a while.