Fig. 11
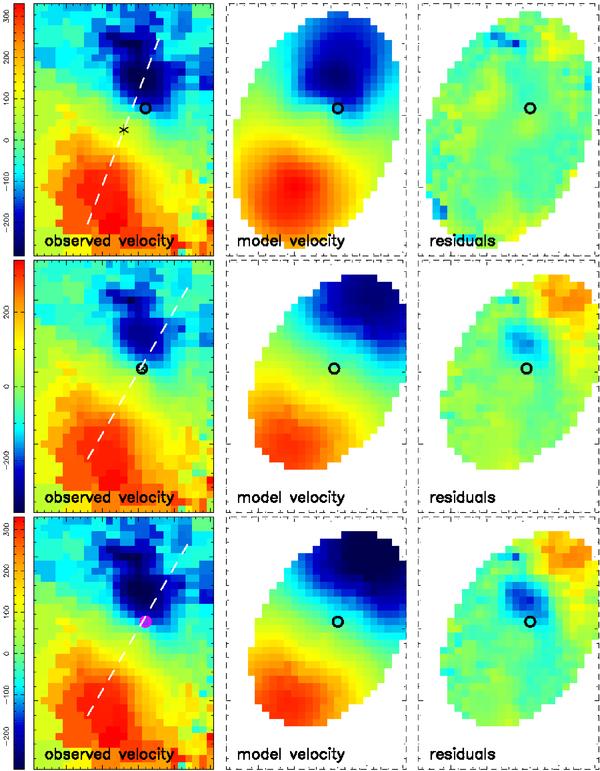
Southern Nucleus: comparison of kinemetry models for different PAs and kinematic centres. It should be noted that the rotation curves do not differ significantly for the two different positions of the kinematic centre. Black circles indicate black hole positions; black stars represent the kinematic centre; the dashed white line traces the major axis of rotation. Left to right: velocity map, model, and residuals. First row: best-fitting kinematic centre from kinemetry analysis. Average residuals per pixel are 28.2 km s-1. Second row: kinematic centre fixed at the position of the AGN; average residuals per pixel are 45.9 km s-1. Third row: kinematic centre fixed at position of the AGN and performing fit only to southern half of nucleus. Average residuals per pixel over southern half are 21.1 km s-1. Image size is 600 × 840 pc.
Current usage metrics show cumulative count of Article Views (full-text article views including HTML views, PDF and ePub downloads, according to the available data) and Abstracts Views on Vision4Press platform.
Data correspond to usage on the plateform after 2015. The current usage metrics is available 48-96 hours after online publication and is updated daily on week days.
Initial download of the metrics may take a while.