Fig. 1
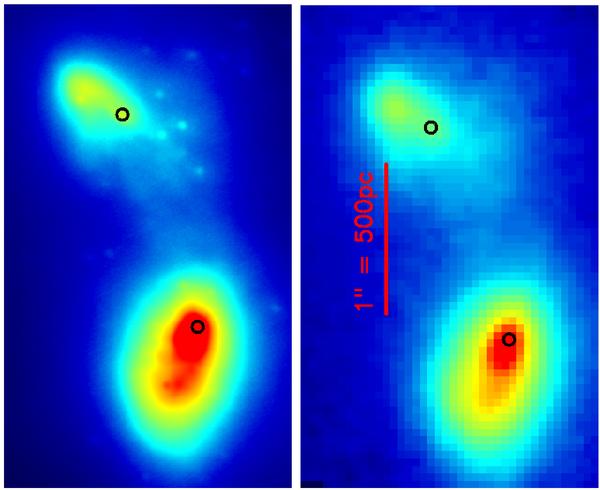
K-band adaptive optics images of NGC 6240 in square-root colour scale. Left: K-band flux density from NIRC2 on Keck II (pixel scale 0.01″, Pollack et al. 2007; Max et al. 2007). Right: 2.2 μm continuum from SINFONI on the VLT (pixel scale 0.05″), covering approximately the same field as left. In both panels, circles indicate AGN positions (see Sect. 5), north is up and east is left, and the red bar indicates 1″ (500 pc).
Current usage metrics show cumulative count of Article Views (full-text article views including HTML views, PDF and ePub downloads, according to the available data) and Abstracts Views on Vision4Press platform.
Data correspond to usage on the plateform after 2015. The current usage metrics is available 48-96 hours after online publication and is updated daily on week days.
Initial download of the metrics may take a while.