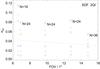
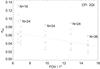
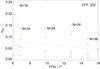
Fig.10

Standard deviations of errors. σerr for different FOV sizes and CAs. Red: r0 = 20 cm; Green: r0 = 10 cm; Blue: r0 = 7 cm. N × N-pixel subfields. Diamonds (◇): image scale 0″̣41/pixel, varying N = {16,24,36} as labeled in the plots; Down triangles (▿): 0″̣29/pixel, N = 24; Up triangles (▵): 0″̣53/pixel, N = 24. Symbols below the dotted line correspond to data without noise, above the line with 1% noise. Note different vertical scales.
Current usage metrics show cumulative count of Article Views (full-text article views including HTML views, PDF and ePub downloads, according to the available data) and Abstracts Views on Vision4Press platform.
Data correspond to usage on the plateform after 2015. The current usage metrics is available 48-96 hours after online publication and is updated daily on week days.
Initial download of the metrics may take a while.