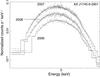
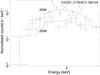
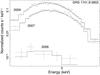
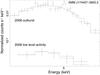
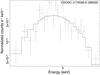
Fig. 3

Background corrected Swift/XRT average outburst spectra. For AX J1745.6–2901, CXOGC J174535.5–290124 and GRS 1741–2853, spectra of the different outbursts captured during the 2006–2009 Swift/XRT monitoring are plotted together. The plot of XMM J174457–2850.3 shows the average outburst spectrum of the source in 2008, as well as the spectrum of the low-level activity observed in the months following this outburst.
Current usage metrics show cumulative count of Article Views (full-text article views including HTML views, PDF and ePub downloads, according to the available data) and Abstracts Views on Vision4Press platform.
Data correspond to usage on the plateform after 2015. The current usage metrics is available 48-96 hours after online publication and is updated daily on week days.
Initial download of the metrics may take a while.