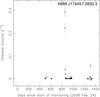
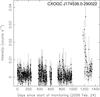
Fig. 2
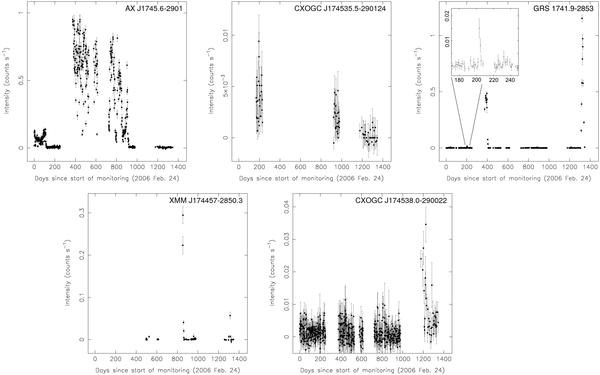
Background corrected 0.3–10 keV Swift/XRT lightcurves of the five transients that were active in 2008–2009 (PC mode data only). Displayed is their long-term behavior from the start of the monitoring campaign of the GC on 2006 February 24. Days 0–616 cover the years 2006 and 2007 (discussed in Degenaar & Wijnands 2009), whereas days 725–1346 represent the new data assembled in 2008–2009. The lightcurve of GRS 1741–2853 shows a magnified image of the short and weak outburst that occurred in 2006.
Current usage metrics show cumulative count of Article Views (full-text article views including HTML views, PDF and ePub downloads, according to the available data) and Abstracts Views on Vision4Press platform.
Data correspond to usage on the plateform after 2015. The current usage metrics is available 48-96 hours after online publication and is updated daily on week days.
Initial download of the metrics may take a while.