Fig. 4
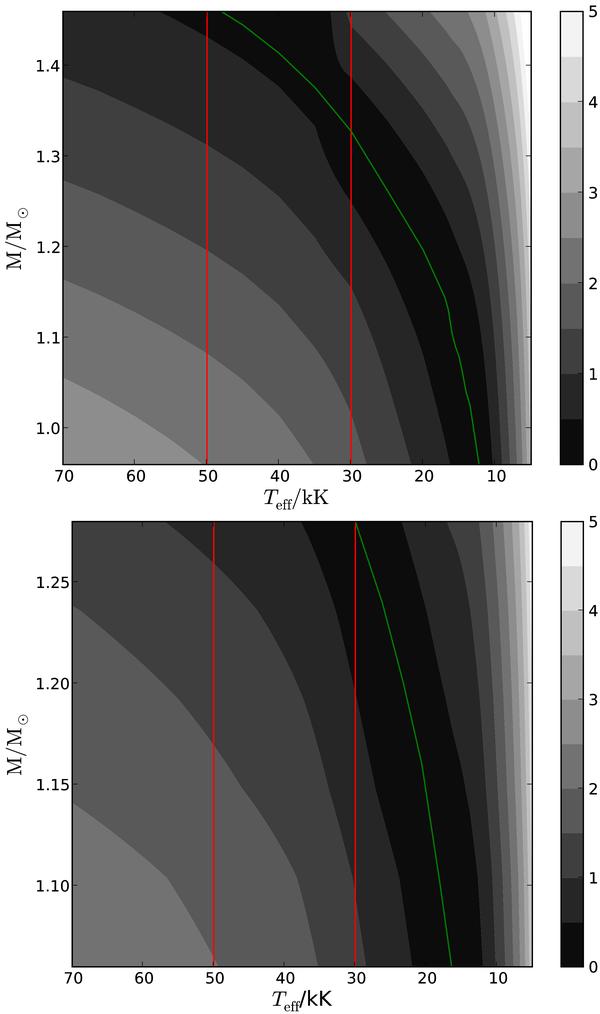
Contour plots for  mag as a function of mass in M⊙ and Teff for CO (top), ONe (bottom) core compositions constructed according to Eq. (1) and theoretical models from Wood (1995), Holberg & Bergeron (2006) for the CO models, and Althaus et al. (2005, 2007) for the ONe models. The bar to the right indicates the colour coding for the magnitude differences, the line in the darkest region
  mag delinating
  and the vertical lines the possible range of effective temperatures (30 000–50 000 K).


Current usage metrics show cumulative count of Article Views (full-text article views including HTML views, PDF and ePub downloads, according to the available data) and Abstracts Views on Vision4Press platform.
Data correspond to usage on the plateform after 2015. The current usage metrics is available 48-96 hours after online publication and is updated daily on week days.
Initial download of the metrics may take a while.