| Issue |
A&A
Volume 524, December 2010
|
|
|---|---|---|
| Article Number | A48 | |
| Number of page(s) | 6 | |
| Section | Catalogs and data | |
| DOI | https://doi.org/10.1051/0004-6361/201015193 | |
| Published online | 23 November 2010 | |
Research Note
Long-term lightcurves from combined unified very high energy γ-ray data⋆
1
DESY Platanenallee 6,
15738
Zeuthen,
Germany
e-mail: martin.tluczykont@desy.de
2
Now at Universität Hamburg, Luruper Chaussee 149, 22761
Hamburg,
Germany
3
Now at Isaac Newton Group of Telescopes, Apartado de correos 321,
38700 Santa Cruz de la Palma, Canary
Islands, Spain
4
Now at Max Plank Institut für Physik, Föhringer Ring 6, 80805
Muenchen,
Germany
5
Now at Erlangen Centre for Astroparticle Physics,
Erwin-Rommel-Str. 1, 91058
Erlangen,
Germany
Received:
10
June
2010
Accepted:
11
October
2010
Context. Very high-energy (VHE, E > 100 GeV) γ-ray data are a valuable input for multi-wavelength and multi-messenger (e.g. combination with neutrino data) studies.
Aims. We aim at the conservation and homogenization of historical, current, and future VHE γ-ray-data on active galactic nuclei (AGN).
Methods. We have collected lightcurve data taken by major VHE experiments since 1991 and combined them into long-term lightcurves for several AGN, and now provide our collected datasets for further use. Due to the lack of common data formats in VHE γ-ray astronomy, we have defined relevant datafields to be stored in standard data formats. The time variability of the combined VHE lightcurve data was investigated, and correlation with archival X-ray data collected by RXTE/ASM tested.
Results. The combination of data on the prominent blazar Mrk 421 from different experiments yields a lightcurve spanning more than a decade. From this combined dataset we derive an integral baseline flux from Mrk 421 that must be lower than 33% of the Crab Nebula flux above 1 TeV. The analysis of the time variability yields log-normal flux variations in the VHE-data on Mrk 421.
Conclusions. Existing VHE data contain valuable information concerning the variability of AGN and can be an important ingredient for multi-wavelength or multi-messenger studies. In the future, upcoming and planned experiments will provide more data from many transient objects, and the interaction of VHE astronomy with classical astronomy will intensify. In this context a unified and exchangeable data format will become increasingly important.
Key words: gamma rays: general / galaxies: active / BL Lacertae objects: general / BL Lacertae objects: individual: Mrk 421 / BL Lacertae objects: individual: Mrk 501
Our data collection is available at the url: http://nuastro-zeuthen.desy.de/magic_experiment/projects/light_curve_archive/index_eng.html
© ESO, 2010
1. Introduction
The broad-band emission observed from active galactic nuclei (AGN) spans the complete electromagnetic spectrum from radio to VHE (very high-energy, E > 100 GeV) γ-rays. Since the discovery of the blazar Mrk 421 in the VHE regime (Punch et al. 1992), many new detections of AGNs by different experiments have been reported (see, e.g. Horns 2008; Hinton & Hofmann 2009, for reviews). Strong flux variations on different timescales were observed from many AGNs. Variability in the VHE γ-ray regime was measured down to the minute timescale (Albert et al. 2008b; Aharonian et al. 2007). Many AGN lightcurves were produced by different γ-ray experiments from observations of flaring states, dedicated monitoring programs, or from joint campaigns with other experiments. Long-term γ-ray lightcurves are valuable to address open questions concerning AGNs, such as possible periodicities (see Thieler et al. 2010, an analysis using
the data collection of the present publication), the log-normality of their flux state distribution, the nature of the radiation mechanism of AGNs, or the estimation of their dutycycle.
A log-normal behavior can be indicative of a multiplicative process of the underlying mechanism governing the variability of the object. In the case of AGNs, this could be evidence for a connection of the observed emission to accretion disk activity (see Giebels & Degrange 2009, and references therein). Previously, log-normal flux variations were reported in the X-ray band from two objects: the narrow-line Seyfert 1 galaxy IRAS 13244-3809 (Gaskell 2004) and BL Lac (Giebels & Degrange 2009). In VHE data, log-normal variability was observed from a high flux state of the BL Lac object PKS 2155-304 (Degrange et al. 2008).
The nature of the AGN radiation mechanism in the VHE regime, i.e. whether the observed radiation has a leptonic or hadronic origin, still remains ambiguous. The detection of neutrinos from these objects would prove the existence of a hadronic component. In the framework of multi-messenger strategies (e.g., combining electromagnetic with neutrino data), the phenomenology of lightcurves in the electromagnetic wavelength band can give valuable input. The Neutrino triggered Target of Opportunity (NToO) program (Bernardini 2005; Ackermann et al. 2008) is based on the idea of neutrino events from a variable object (single events or multiplets) that are used to trigger VHE monitoring of the same object. Coincidences between neutrino triggers and γ-ray flux high states, which occur more often than expected from random coincidence with atmospheric neutrinos, would be evidence of a hadronic component of the VHE γ-ray signal and a cosmic origin of the neutrinos. Long-term γ-ray lightcurves can be used to estimate the AGN dutycycle, which is an important input parameter for such analyses.
2. Lightcurve data
Considering the heterogeneous nature of historical and present VHE data comprising different file and content formats from different experiments, a common data format is desirable. Moreover, as described above, VHE astronomy has already started to interface strongly with different fields of classical astronomy. In view of an effective exchange and diffusion of VHE data within the astronomy and astroparticle community, our storage strategy is to use an ascii file format (SLF) and the widely used FITS and VOTable file formats (see following section).
The use of a standard data format will also become increasingly important in the framework of the next-generation Cherenkov telescope systems, such as the upcoming CTA (Cherenkov Telescope Array) experiment (see e.g. Martinez 2008). In the CTA era, VHE astronomy will intensify multiwavelength (and multimessenger) interactions with other fields. Furthermore, a standard data format is essential for running an experiment like an observatory, and make it open to the whole astronomy community.
Publicly available lightcurve data from 1992 until today were collected from the Whipple (Kerrick et al. 1995; Schubnell et al. 1996; Buckley et al. 1996; Maraschi et al. 1999a), HEGRA (Aharonian et al. 1999b,a; Krawczynski et al. 2001b; Aharonian et al. 2001, 2002, 2003, 2004; Kestel 2002), CAT (Piron 2000; Piron et al. 2001), HESS (Aharonian et al. 2005, 2006), MAGIC (Albert et al. 2008a; Donnarumma et al. 2009), and VERITAS (Rebillot et al. 2006; Donnarumma et al. 2009) experiments. We are also working on collecting more data from these and other experiments such as the Crimean GT-48 Cherenkov telescope (e.g. Neshpor et al. 2007), the Tibet air-shower array (e.g. Amenomori et al. 2003), or the Patchmarhi Cherenkov Telescope Array (e.g. Gupta et al. 2008).
2.1. Data collection and formatting
Different formats and standards are used by different experiments. We use simple directly usable ascii tables and the standard astronomy file formats FITS and VOTable to store the collected, combined data. In the present work, the types and units of the FITS/VOTable datafields (i.e. columns) follow a simple lightcurve format (hereafter SLF) given in Table 1. The data are also provided in ascii file form following the SLF definition. These files are referred to as slf-files. The tables contain rows of (typically nightwise) integral flux-measurements and further information necessary for subsequent analyses. The units of the datafields are defined within the FITS/VOTable files and follow the conventions defined in Table 1 within the slf-files (ascii).
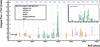 |
Fig. 1 Long-term lightcurve of Mrk 421 (day-wise integral flux). Data from the major γ-ray telescopes were combined and normalized to the same energy threshold (1 TeV) and converted to Crab units (see text). A zoom into the period of strong activity (2000/2001) is also shown. |
The SLF datafield format definition provides the means to effectively combine heterogeneous datasets. In case further information than included in Cols. 1 to 12 are necessary, additional entries are foreseen. For example, to define a spectral shape different from the standard pure powerlaw, the spectral parameterization together with the additional parameters must be defined as comments within the data files. In case of lightcurve data only containing information on a few datafields, the flexibility of the binary FITS and VOTable file format allows minimizing the data volume. For example, if only the observation date and the flux value are known for the total lightcurve data of an object, the binary file can only contain MJDstart and F, along with the definition of units used. While this example represents the simplest case of a homogeneous dataset, in practice, the heterogeneous lightcurve data combinations from different experiments can include information on a specific datafield for one subset of the combined data (i.e. for one experiment), and not for another subset. In this (most common) case, when information is not available for datafields of some of the measurements, the following conventions for default datafield values apply.
-
If no start and end times are known, then MJDstart is set to the same value as MJDmid, i.e. the middle of the exposure time, and MJDend to −1. In this case the duration might still be given.
-
In some cases only the MJD of the observations day is known. Then, MJDmid is the MJD of the observation day.
-
Most energy spectra can be described by a pure powerlaw (differential spectral index α) or a powerlaw with an exponential cutoff (cutoff energy Ecutoff). Additional fields are foreseen for cases with different parameterizations of the energy spectrum. If such a different parameterization is given, a defining formula containing the relevant fields has to be written in the comment section of the lightcurve file.
-
The flux-flag (fflag) is a one-character flag indicating whether the integral flux F is an upper limit (fflag = “ < ”) or a flux measurement (fflag = “=”).
-
In the present work, we chose Crab Nebula flux units for the observed integral flux F above the energy threshold Ethr.
-
For any other entry, the value −1 means that no information is available.
2.2. Lightcurve combination
For a combination of lightcurves from different experiments, the measured integral flux values must be converted to a common energy threshold. For the results in this paper, we chose an energy threshold of 1 TeV. The conversion of integral fluxes in Crab units to the same energy threshold requires knowledge of the energy spectrum of the considered object and of the Crab Nebula as measured by the same experiment. The differential energy spectrum of the Crab Nebula in the energy range covered by most VHE γ-ray experiments is described well by a pure powerlaw of the form 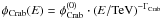 in the energy range from 100 GeV to few tens of TeV. Deviations from the pure powerlaw form at both ends of this energy range (as expected in the framework of the inverse Compton scenario) were not taken into account here. Extrapolation to energies below 100 GeV requires a full parameterization of the spectral energy distribution of the Crab Nebula (e.g. Aharonian et al. 2004). An integral flux in Crab units above the energy threshold Ethr is given by
 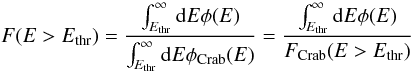 (1)where φ(E) and φCrab(E) are the differential energy spectra of the source and of the Crab Nebula (in units of photons TeV-1 cm-2 s-1). The corresponding integral fluxes above a given energy threshold are denoted with F(E > Ethr). In the case of a pure powerlaw differential energy spectrum φ(E), the conversion of an observed integral flux F(E > E0) to a given threshold energy Ethr is given by
 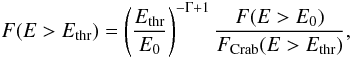 (2)where E0 is the energy threshold of the observation.
The combined day-wise, integral flux lightcurve of the BL Lac object Mrk 421 above 1 TeV is shown in Fig. 1. This lightcurve includes all data we have collected so far, covering an uprecedented 17-year time-span from 1992 to 2008. In Fig. 2, the day-wise integral flux lightcurve of the BL Lac object Mrk 501 is shown.
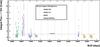 |
Fig. 2 Long-term lightcurve of Mrk 501. Available data were combined and normalized. Shown are the day-wise integral fluxes above 1 TeV in units of the Crab Nebula flux. |
2.3. Systematic errors
The inhomogeneity of data combined from different experiments and the inclusion of data from the pioneering time of VHE γ-ray astronomy induces systematic errors that are not easily evaluated. Combination of data from many different experiments, different time periods, partly inaccurate flux normalizations (i.e. γ-ray rate measurements) and energy thresholds can lead to systematic errors in the relative flux normalizations. When combining data, the flux normalization depends on assumptions on the spectral shape and the energy threshold. Here, limiting factors can be experimental uncertainties (especially in old data) induced by poor knowledge of atmospheric conditions, aging detector effects, and intrinsic spectral variability of the considered objects. We convert flux and rate measurements to Crab Nebula flux units using Crab Nebula data taken by the same experiment as close in time as possible, therewith reducing systematic uncertainties induced by seasonal or instrumental variations.
The error on the reconstructed spectral shape results in an error on the flux state when converting to different thresholds. For example, when converting integral fluxes from 1 TeV to 100 GeV, typical systematic errors on the spectral index of 0.1 (pure powerlaw case) lead to a relative systematic error on the integral flux of 30% due to this extrapolation. The datafields contained in our FITS files provide all information needed to estimate these systematic errors for conversion to different energy thresholds. A conversion over a narrower energy range than used in this example limits this systematic error to less than 30%.
The flux units used in some publications are given in uncalibrated units (e.g. counts per minute), i.e. as an instrument-specific γ-ray count-rate. The energy threshold is also unknown in some cases. For flux calibration of lightcurves from the Whipple experiment before 1998, we used Crab Nebula data taken by the same experiment as close in time as possible (see Hillas et al. 1998, and references therein). However, due to dependencies on zenith angle and weather conditions, normalization of rate measurements is very uncertain. We estimate that the systematic error induced when including rate measurements is below 40%. This form of relative systematic error can be avoided when restricting analysis to flux measurements, by restricting to data from a single experiment, or by intercalibrating the different measurements when observations from different experiments overlap.
3. Discussion
Significant evidence of a correlated gamma- and X-ray emission of blazars was presented in earlier studies (see e.g. Takahashi et al. 1996; Buckley et al. 1996; Maraschi et al. 1999b; Krawczynski et al. 2001a; Neshpor et al. 2007). Usually the reported correlation is linear, but in a few cases a quadratic relation between the fluxes in both bands was found (see e.g. Krawczynski et al. 2000). Such a correlation provides us with essential information on the underlying acceleration and emission processes and is especially valuable for variability studies. Very often the gamma- X-ray correlation is interpreted as a strong argument in favor of the so-called synchrotron-Compton jet emission models in which the same population of ultrarelativistic electrons is responsible for production of both X-rays via synchrotron radiation and TeV γ-rays via inverse Compton scattering (Katarzyński et al. 2005). However, it can also be accommodated in the hadronic framework in particular in models which assume that the observed γ-ray emission is a result of interactions of accelerated protons and ambient gas or low-frequency radiation (Aharonian 2000; Mücke et al. 2003).
Using contemporanous X-ray data extracted from the RXTE/ASM database web interface at MIT1, we calculated correlation coefficients between the VHE and X-ray bands. For each VHE measurement, an average ASM count rate was calculated centered on the VHE observation date (±6 h). Only using measurements with a significance of at least 3 standard deviations for the VHE data and 10 counts for the ASM measurement, these data yield correlation coefficients (Spearman rank) of 0.65 for Mrk 421 and 0.68 for Mrk 501. In both cases, the probability of an uncorrelated system producing datasets with similar Spearman rank correlation coefficients is less than 10-8. The flux measurements in both wavelength bands are not strictly simultaneous. However, they represent a measure for the average daily flux state of the objects, and the observed behavior is consistent with correlated average VHE/X-ray daily flux levels modulated by shorter term flux variations.
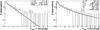 |
Fig. 3 Distribution of VHE flux states of Mrk 421. An exponential function fit above a flux of 0.25 Crab (avoiding detector threshold effects) can describe the data (left). The data are very well described by a fit of a Gaussian+log-normal distribution (right). |
In Fig. 3, the distribution of the VHE flux states of Mrk 421 (also see Fig. 1) is shown. Each entry of this histogram represents a snapshot flux measurement of Mrk 421 as given by the combined dataset. All individual observed integral flux values were converted to flux values in units of the Crab Nebula flux and normalized to a common energy threshold of 1 TeV. The observed energy spectra of the Crab Nebula and Mrk 421 as observed by the individual experiments were taken into account. The overall distribution can be described by an exponential law (left panel) above a flux of a few tenths of Crab. An exponential shape might indicate that the measured flux states mainly reflect a stochastic outburst state of the object. As shown in the right panel of Fig. 3, a better fit to the data is obtained when using the sum of a Gaussian and a log-normal distribution (Aitchison & Brown 1957; Limpert et al. 2001), as given by 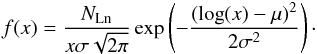 (3)The data were further divided into time intervals of equal length, each comprising 40 flux observations fi with statistical errors σi. The excess variance
 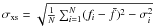 (Vaughan et al. 2003) was calculated for each time interval. The excess variance σxs is a measure of the Poisson noise corrected rms value of the fluxes within the corresponding time interval. Figure 4 shows σxs as a function of the average flux
  within the interval. A clear proportionality is seen with σxss(0.95 ± 0.10)fi. A log-normally shaped distribution with a proportionality of the excess variance with the flux are evidence of log-normal flux variations (Aitchison & Brown 1957).
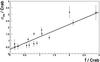 |
Fig. 4 The excess variance σxs as a function of the average flux within equal-length intervals. A line fit corresponding to σxss(0.95 ± 0.10)fi is also given. |
Below a flux level of few tenths of Crab, one might expect a low baseline flux level that can be described by a Gaussian. At these low fluxes, however, detector sensitivity threshold effects become increasingly important, i.e. lower fluxes cannot be detected significantly within the short observation windows. Therefore, the mean of the Gaussian fit (0.33 Crab flux units) must be treated as an absolute upper limit on the integral baseline flux above 1 TeV from Mrk 421. More information such as the variability type (e.g. red noise/white noise/blue noise) or the duty-cycle of the object can be extracted from the flux state distributions. Previously, first steps in this direction were taken by Tluczykont et al. (2007); however, further investigations are necessary using simulations and will be the topic of a subsequent publication.
With increasing exposure achieved by the major current generation experiments more data will soon be available. As discussed previously, one important aspect for long-term variability studies will be to carry out unbiased (random) observations to avoid systematic selection effects.
4. Summary and outlook
VHE γ-ray flux measurements of AGN have been collected from observations of different experiments since 1992. For the first time these data were combined into single long-term lightcurves, and are provided for further analysis in the standard FITS file format. The BL Lac object Mrk 421 yields the most extended dataset with a combined lightcurve spanning more than a decade. The collected data is publicly available for download2.
The observed flux states averaged over 12 h of Mrk 421 and Mrk 501 above 1 TeV are consistent within statistical and systematic errors with a linear correlation with daily averaged RXTE/ASM X-ray count rates, with correlation coefficients of 0.65 and 0.68 respectively.
The long-term flux state distribution of Mrk 421 can be well described by the sum of a Gaussian and a log-normal distribution. This behavior can be interpreted by the observation of a baseline flux and a stochastic flux state population governed by an underlying multiplicative process. In the framework of this interpretation, the combined dataset on Mrk 421 allowed setting an absolute upper limit on the baseline flux of Mrk 421 of 0.33 Crab flux units above 1 TeV.
Unbiased data from monitoring campaigns by ongoing experiments (for a review see Weekes 2008) and data from future experiments such as CTA will further extend the long-term coverage of variable objects. A unified standard data format will become increasingly important in the future, when more high-sensitivity VHE data becomes available, and when interfacing with other fields of classical astronomy and astroparticle physics (multi-wavelength and multi-messenger) intensifies. We intend to store these future data as described in this work in standard data formats using the introduced SLF field structure definition.
Acknowledgments
We thank all colleagues who provided data in electronic form to us. M.T. thanks Dr. B. Giebels and Prof. Dr. D. Horns for valuable discussions. We thank Dr. B. Pence for helpful comments on an ealier draft. This research has made use of NASA’s Astrophysics Data System Bibliographic Services.
References
- Ackermann, M., Bernardini, E., Galante, N., et al. 2008, in International Cosmic Ray Conference, 3, 1257 [Google Scholar]
- Aharonian, F. A. 2000, New A, 5, 377 [NASA ADS] [CrossRef] [Google Scholar]
- Aharonian, F., Akhperjanian, A. G., Barrio, J. A., et al. 1999a, A&A, 349, 29 [NASA ADS] [Google Scholar]
- Aharonian, F. A., Akhperjanian, A. G., Barrio, J. A., et al. 1999b, A&A, 342, 69 [NASA ADS] [Google Scholar]
- Aharonian, F., Akhperjanian, A., Barrio, J., et al. 2001, ApJ, 546, 898 [NASA ADS] [CrossRef] [Google Scholar]
- Aharonian, F., Akhperjanian, A., Beilicke, M., et al. 2002, A&A, 393, 89 [NASA ADS] [CrossRef] [EDP Sciences] [Google Scholar]
- Aharonian, F., Akhperjanian, A., Beilicke, M., et al. 2003, A&A, 410, 813 [NASA ADS] [CrossRef] [EDP Sciences] [Google Scholar]
- Aharonian, F., Akhperjanian, A., Beilicke, M., et al. 2004, ApJ, 614, 897 [NASA ADS] [CrossRef] [Google Scholar]
- Aharonian, F., Akhperjanian, A. G., Aye, K., et al. 2005, A&A, 437, 95 [NASA ADS] [CrossRef] [EDP Sciences] [Google Scholar]
- Aharonian, F., Akhperjanian, A. G., Bazer-Bachi, A. R., et al. 2006, A&A, 457, 899 [NASA ADS] [CrossRef] [EDP Sciences] [Google Scholar]
- Aharonian, F., Akhperjanian, A. G., Bazer-Bachi, A. R., et al. 2007, ApJ, 664, L71 [Google Scholar]
- Aitchison, J., & Brown, J. A. C. 1957, The Lognormal Distribution (Cambridge: Cambridge University Press) [Google Scholar]
- Albert, J., Aliu, E., Anderhub, H., et al. 2008a, ApJ, 674, 1037 [NASA ADS] [CrossRef] [Google Scholar]
- Albert, J., Aliu, E., Anderhub, H., et al. 2008b, Phys. Lett. B, 668, 253 [NASA ADS] [CrossRef] [Google Scholar]
- Amenomori, M., Ayabe, S., Cui, S. W., et al. 2003, ApJ, 598, 242 [NASA ADS] [CrossRef] [Google Scholar]
- Bernardini, E. 2005, in Proceedings Towards A Network Of Cherenkov Detectors VII, ed. B. Degrange, Palaiseau, 307 [Google Scholar]
- Buckley, J. H., Akerlof, C. W., Biller, S., et al. 1996, ApJ, 472, L9 [NASA ADS] [CrossRef] [Google Scholar]
- Degrange, B., Superina, G., Giebels, B., & Volpe, F. 2008, in Blazar Variability across the Electromagnetic Spectrum [Google Scholar]
- Donnarumma, I., Vittorini, V., Vercellone, S., et al. 2009, ApJ, 691, L13 [Google Scholar]
- Gaskell, C. M. 2004, ApJ, 612, L21 [NASA ADS] [CrossRef] [Google Scholar]
- Giebels, B., & Degrange, B. 2009, A&A, 503, 797 [NASA ADS] [CrossRef] [EDP Sciences] [Google Scholar]
- Gupta, A. C., Acharya, B. S., Bose, D., Chitnis, V. R., & Fan, J. 2008, Chinese J. Astron. Astrophys., 8, 395 [Google Scholar]
- Hillas, A. M., Akerlof, C. W., Biller, S. D., et al. 1998, ApJ, 503, 744 [NASA ADS] [CrossRef] [Google Scholar]
- Hinton, J. A., & Hofmann, W. 2009, ARA&A, 47, 523 [NASA ADS] [CrossRef] [Google Scholar]
- Horns, D. 2008, in Rev. Mod. Astron., ed. S. Röser, 20, 167 [Google Scholar]
- Katarzyński, K., Ghisellini, G., Tavecchio, F., et al. 2005, A&A, 433, 479 [NASA ADS] [CrossRef] [EDP Sciences] [Google Scholar]
- Kerrick, A. D., Akerlof, C. W., Biller, S. D., et al. 1995, ApJ, 438, L59 [NASA ADS] [CrossRef] [Google Scholar]
- Kestel, M. 2002, Ph.D. Thesis, Technische Universität München, Germany [Google Scholar]
- Krawczynski, H., Coppi, P. S., Maccarone, T., & Aharonian, F. A. 2000, A&A, 353, 97 [NASA ADS] [Google Scholar]
- Krawczynski, H., Coppi, P. S., Maccarone, T., & Aharonian, F. A. 2001a, X-ray Astronomy: Stellar Endpoints, AGN, and the Diffuse X-ray Background, 599, 694 [Google Scholar]
- Krawczynski, H., Sambruna, R., Kohnle, A., et al. 2001b, ApJ, 559, 187 [NASA ADS] [CrossRef] [Google Scholar]
- Limpert, E., Stahel, W., & Abbt, M. 2001, BioScience, 51, 341 [CrossRef] [Google Scholar]
- Maraschi, L., Fossati, G., Tavecchio, F., et al. 1999a, ApJ, 526, L81 [NASA ADS] [CrossRef] [PubMed] [Google Scholar]
- Maraschi, L., Fossati, G., Tavecchio, F., et al. 1999b, Astropart. Phys., 11, 189 [Google Scholar]
- Martinez, M. 2008, in American Institute of Physics Conf. Ser., ed. F. A. Aharonian, W. Hofmann, & F. Rieger, 108, 824 [Google Scholar]
- Mücke, A., Protheroe, R. J., Engel, R., Rachen, J. P., & Stanev, T. 2003, Astropart. Phys., 18, 593 [NASA ADS] [CrossRef] [Google Scholar]
- Neshpor, Y. I., Eliseev, V. S., Jogolev, N. A., et al. 2007, Bull. Crimean Astrophys. Obs., 103, 16 [NASA ADS] [CrossRef] [Google Scholar]
- Piron, F. 2000, Ph.D. Thesis, AA, Université de Paris-Sud, Paris XI [Google Scholar]
- Piron, F., Djannati-Atai, A., Punch, M., et al. 2001, A&A, 374, 895 [NASA ADS] [CrossRef] [EDP Sciences] [Google Scholar]
- Punch, M., Akerlof, C. W., Cawley, M. F., et al. 1992, Nature, 358, 477 [NASA ADS] [CrossRef] [Google Scholar]
- Rebillot, P. F., Badran, H. M., Blaylock, G., et al. 2006, ApJ, 641, 740 [NASA ADS] [CrossRef] [Google Scholar]
- Schubnell, M. S., Akerlof, C. W., Biller, S., et al. 1996, ApJ, 460, 644 [NASA ADS] [CrossRef] [Google Scholar]
- Takahashi, T., Tashiro, M., Madejski, G., et al. 1996, ApJ, 470, L89 [NASA ADS] [CrossRef] [Google Scholar]
- Thieler, A., et al. 2010, Private Communication, DPG Conference, Bonn [Google Scholar]
- Tluczykont, M., Shayduk, M., Kalekin, O., & Bernardini, E. 2007, in TeV Particle Astrophysics II Workshop, ed. T. M. F. Halzen, J. Phys. Conf. Ser., 60, 318 [NASA ADS] [CrossRef] [Google Scholar]
- Vaughan, S., Edelson, R., Warwick, R. S., & Uttley, P. 2003, MNRAS, 345, 1271 [NASA ADS] [CrossRef] [Google Scholar]
- Weekes, T. C. 2008, in American Institute of Physics Conf. Ser., ed. F. A. Aharonian, W. Hofmann, & F. Rieger, 1085, 3 [Google Scholar]
All Tables
All Figures
|
Fig. 1 Long-term lightcurve of Mrk 421 (day-wise integral flux). Data from the major γ-ray telescopes were combined and normalized to the same energy threshold (1 TeV) and converted to Crab units (see text). A zoom into the period of strong activity (2000/2001) is also shown. |
| In the text | |
|
Fig. 2 Long-term lightcurve of Mrk 501. Available data were combined and normalized. Shown are the day-wise integral fluxes above 1 TeV in units of the Crab Nebula flux. |
| In the text | |
|
Fig. 3 Distribution of VHE flux states of Mrk 421. An exponential function fit above a flux of 0.25 Crab (avoiding detector threshold effects) can describe the data (left). The data are very well described by a fit of a Gaussian+log-normal distribution (right). |
| In the text | |
|
Fig. 4 The excess variance σxs as a function of the average flux within equal-length intervals. A line fit corresponding to σxss(0.95 ± 0.10)fi is also given. |
| In the text | |
Current usage metrics show cumulative count of Article Views (full-text article views including HTML views, PDF and ePub downloads, according to the available data) and Abstracts Views on Vision4Press platform.
Data correspond to usage on the plateform after 2015. The current usage metrics is available 48-96 hours after online publication and is updated daily on week days.
Initial download of the metrics may take a while.