Fig. 8
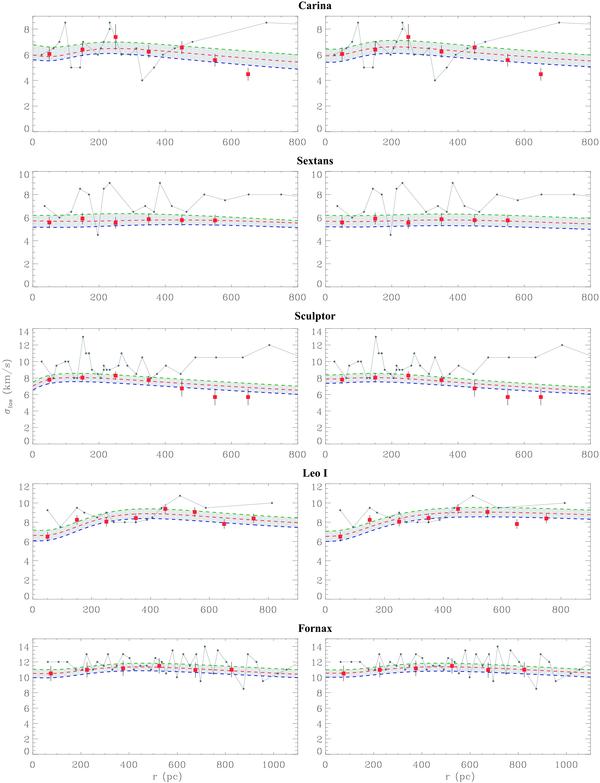
Line-of-sight velocity dispersion profiles for the Walker et al. (2007) uncleaned samples (grey circles) and our cleaned samples (red squares). In the left-hand panels we overplot the best fit MOND models (parameters listed in Table 2) and in the right-hand panels we plot the best fit cored dark matter halo models (parameters in Table 1). The two lines either side of the best fit are the 1-σ errors on the ρDM,0 and rDM parameters.
Current usage metrics show cumulative count of Article Views (full-text article views including HTML views, PDF and ePub downloads, according to the available data) and Abstracts Views on Vision4Press platform.
Data correspond to usage on the plateform after 2015. The current usage metrics is available 48-96 hours after online publication and is updated daily on week days.
Initial download of the metrics may take a while.