Fig. 9
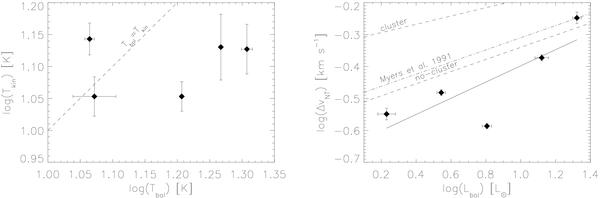
Left: Tkin versus Tbol. The dashed line indicates Tkin = Tbol. Right: ΔvNT versus Lbol. The solid line indicates the least-squares fit to the data. The upper and lower dashed lines represent relationships found by 4 for NH3 cores with and without cluster association, respectively. The dash-dotted line shows the relationships found by Myers et al. (1991) for IRAS point sources. Both plots are in log-log scales.
Current usage metrics show cumulative count of Article Views (full-text article views including HTML views, PDF and ePub downloads, according to the available data) and Abstracts Views on Vision4Press platform.
Data correspond to usage on the plateform after 2015. The current usage metrics is available 48-96 hours after online publication and is updated daily on week days.
Initial download of the metrics may take a while.