Fig. 8
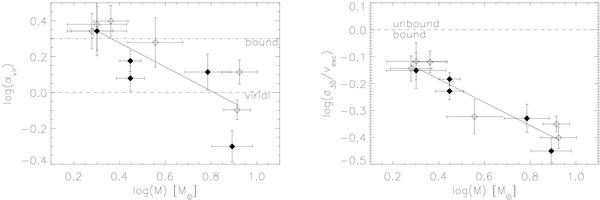
Left: virial parameter versus core mass. The dashed line indicates the virial equilibrium limit (αvir = 1), and the dash-dotted line shows the limit of gravitational boundedness (αvir = 2). Right: ratio of 3D velocity dispersion to escape velocity against core mass. The dashed line indicates σ3D/vesc = 1. All cores are likely to be gravitationally bound. The solid line in both plots indicates the least-squares fit to the data. Both plots are in log-log scales, and the symbol key is identical to that of Fig. 4.
Current usage metrics show cumulative count of Article Views (full-text article views including HTML views, PDF and ePub downloads, according to the available data) and Abstracts Views on Vision4Press platform.
Data correspond to usage on the plateform after 2015. The current usage metrics is available 48-96 hours after online publication and is updated daily on week days.
Initial download of the metrics may take a while.