Fig. 4
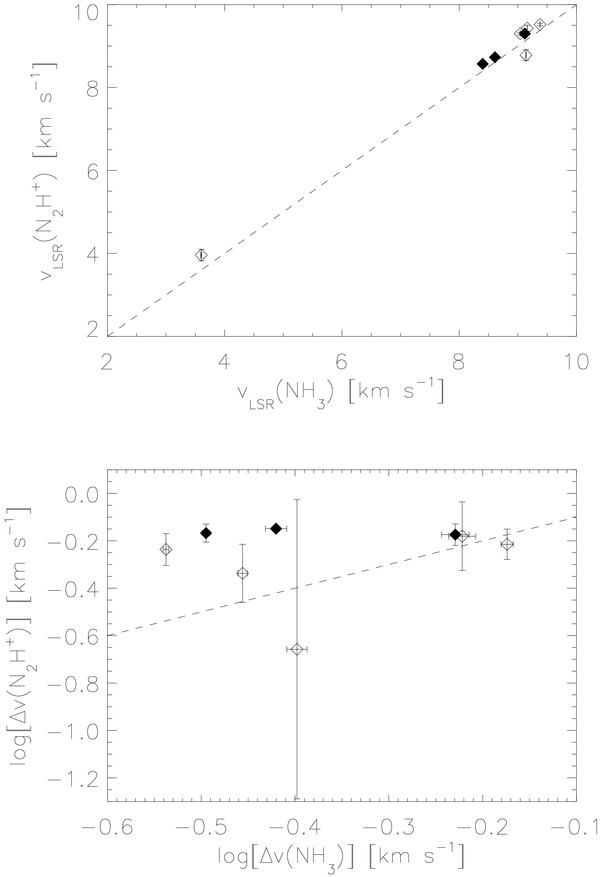
Top: the centroid velocity of the N2H+(3−2) emission versus the velocity of the NH3(1,1) emission. Bottom: Log-log plot of the N2H+(3−2) linewidth versus the NH3(1,1) linewidth. Prestellar cores are indicated by open diamonds and protostellar cores are marked by filled diamonds. In both plots, the dashed line shows the equality.
Current usage metrics show cumulative count of Article Views (full-text article views including HTML views, PDF and ePub downloads, according to the available data) and Abstracts Views on Vision4Press platform.
Data correspond to usage on the plateform after 2015. The current usage metrics is available 48-96 hours after online publication and is updated daily on week days.
Initial download of the metrics may take a while.