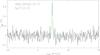
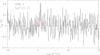
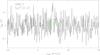
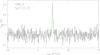
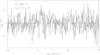
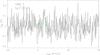
Fig. 3
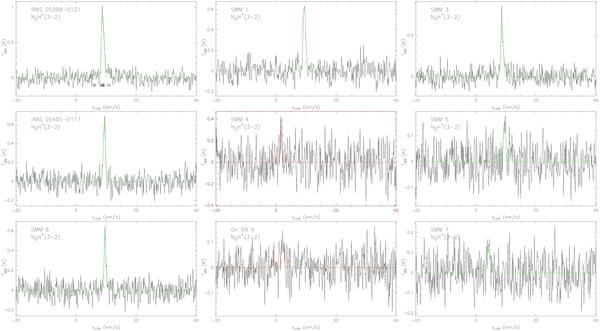
N2H+(3−2) spectra measured from the pre- and protostellar cores in Orion B9. Spectra are overlaid with the 38 component hyperfine structure fits. Hyperfine fits to the second velocity components are indicated by red lines. Note that only the second velocity component is detected towards SMM 4. The relative velocity of each individual hyperfine component is labelled with a short bar on the spectrum towards IRAS 05399-0121 (top left panel). The temperature scale is in TMB.
Current usage metrics show cumulative count of Article Views (full-text article views including HTML views, PDF and ePub downloads, according to the available data) and Abstracts Views on Vision4Press platform.
Data correspond to usage on the plateform after 2015. The current usage metrics is available 48-96 hours after online publication and is updated daily on week days.
Initial download of the metrics may take a while.