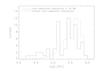
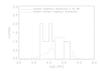
Fig. 11
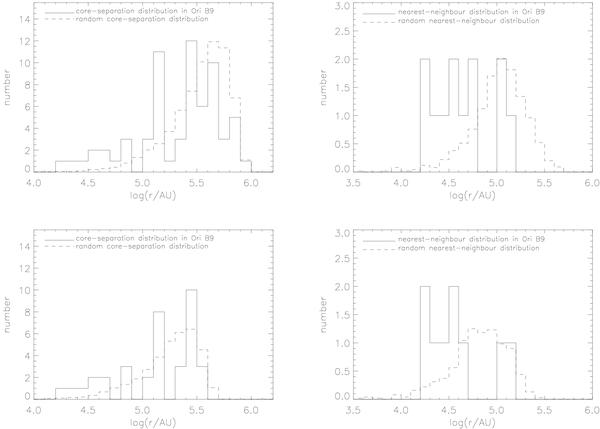
Top left: observed core-separation distribution (solid line) compared with the expected distribution for random distribution of the same number of cores as the observed sample over an identical area (dashed line). Top right: same as in the top left panel but for the nearest-neighbour distribution. Bottom panels: same as in the top panels, but SMM 7, IRAS 05412-0105, and IRAS 05413-0104 have been excluded from the samples.
Current usage metrics show cumulative count of Article Views (full-text article views including HTML views, PDF and ePub downloads, according to the available data) and Abstracts Views on Vision4Press platform.
Data correspond to usage on the plateform after 2015. The current usage metrics is available 48-96 hours after online publication and is updated daily on week days.
Initial download of the metrics may take a while.