Fig. 10
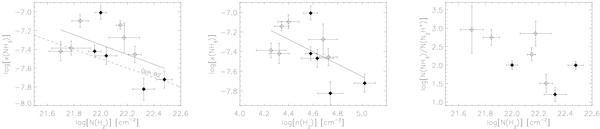
Comparison of chemical abundances as a function of H2 column and number density. All plots are in log-log scales, and the symbol key is identical to that of Fig. 4. The solid lines indicate the least-squares fits to the data. Left: x(NH3) versus N(H2). The dashed line indicates the relationship found by Friesen et al. (2009, 2010) for Oph B2. Middle: x(NH3) versus n(H2). Right: NH3/N2H+ column density ratio versus N(H2).
Current usage metrics show cumulative count of Article Views (full-text article views including HTML views, PDF and ePub downloads, according to the available data) and Abstracts Views on Vision4Press platform.
Data correspond to usage on the plateform after 2015. The current usage metrics is available 48-96 hours after online publication and is updated daily on week days.
Initial download of the metrics may take a while.