Free Access
Fig. 8
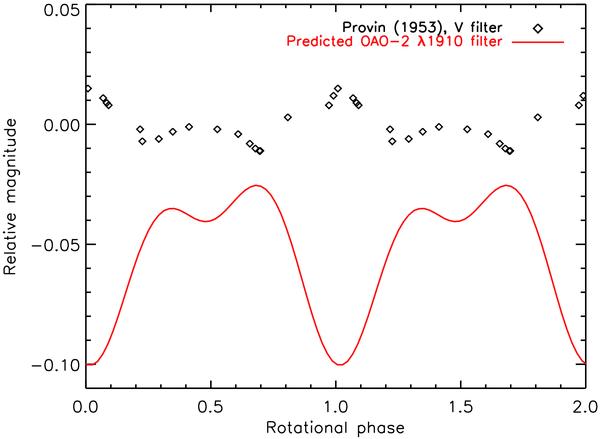
Simulated light curves in the region of Copernicus OAO-2 λ1910 Å filter and optical V-band photometry by Provin (1953). The simulated light curve has been shifted along the y-axis for a clear visualization.
Current usage metrics show cumulative count of Article Views (full-text article views including HTML views, PDF and ePub downloads, according to the available data) and Abstracts Views on Vision4Press platform.
Data correspond to usage on the plateform after 2015. The current usage metrics is available 48-96 hours after online publication and is updated daily on week days.
Initial download of the metrics may take a while.