Fig. 2
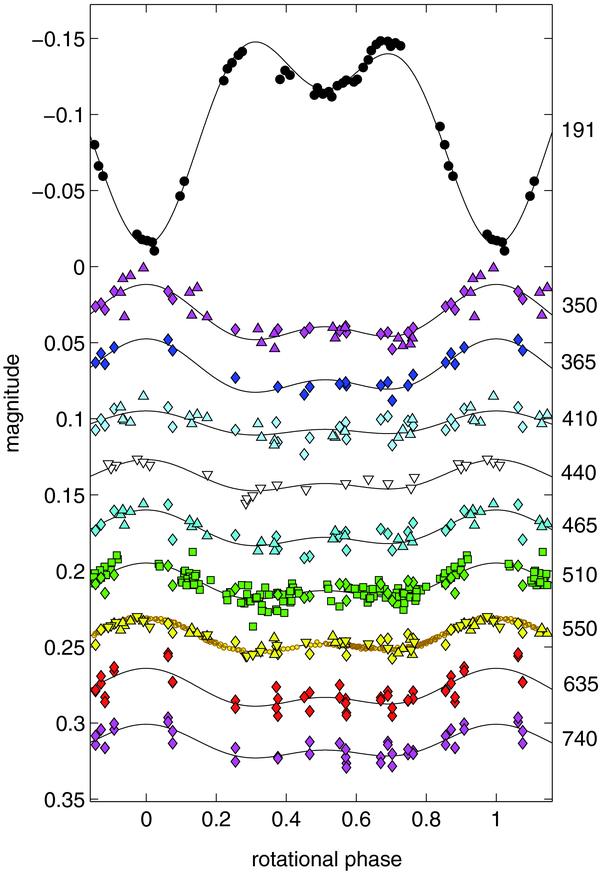
Observed light curves constructed from original data in several passdands, whose effective wavelengths in nm are given on the right. For clarity, individual LCs are shifted in their magnitudes. Full circles – UV photometry from OAO-2 satellite (Molnar 1975), ◇ – 10-color medium-band photometry (Musielok et al. 1980); △ ubvy photometry of Pyper & Adelman (1985); ∇ − BV (Provin 1953); □ − Hipparcos photometry (ESA 1997), and small full circles relate to broad-band photometry of WIRE (Retter et al. 2004) – each point is the median of 1600 individual time-consecutive measurements.
Current usage metrics show cumulative count of Article Views (full-text article views including HTML views, PDF and ePub downloads, according to the available data) and Abstracts Views on Vision4Press platform.
Data correspond to usage on the plateform after 2015. The current usage metrics is available 48-96 hours after online publication and is updated daily on week days.
Initial download of the metrics may take a while.