Fig. 1
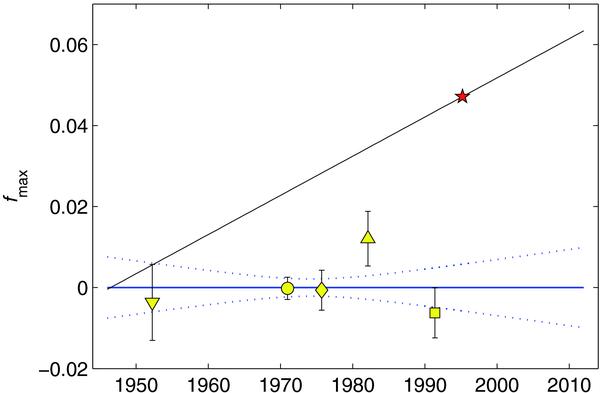
The dependence of the primary maximum phases derived from Eq. (7) on time. ∇ – BV photometry (Provin 1953), full circle – UV photometry from OAO-2 satellite (Molnar 1975); ◇ – 10-color medium-band photometry (Musielok & Madej 1988); □ – Hipparcos photometry (ESA 1997); △ ubvy photometry of Pyper & Adelman (1985), the oblique line represents the Guthnick’s ephemeris from Eq. (1), and the star on it the phase position to which are referred the spectroscopic maps we used.
Current usage metrics show cumulative count of Article Views (full-text article views including HTML views, PDF and ePub downloads, according to the available data) and Abstracts Views on Vision4Press platform.
Data correspond to usage on the plateform after 2015. The current usage metrics is available 48-96 hours after online publication and is updated daily on week days.
Initial download of the metrics may take a while.