Fig. 4
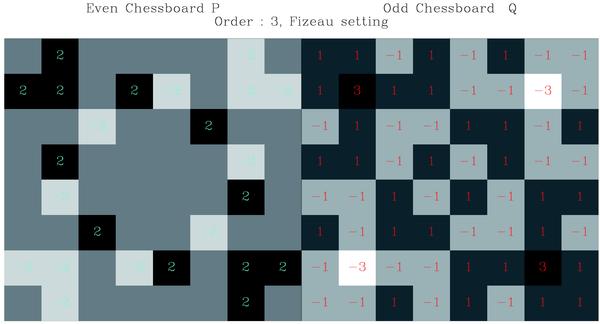
The  chessboards. The
P2, Q2 chessboards from
which they were built are in the top right corners. The 2kπ or
(2k + 1)π phase shifts at
λ0 are indicated in the cells’ centres by their
2k (blue) or 2k + 1 (red) values. The value zero
is not shown.
chessboards. The
P2, Q2 chessboards from
which they were built are in the top right corners. The 2kπ or
(2k + 1)π phase shifts at
λ0 are indicated in the cells’ centres by their
2k (blue) or 2k + 1 (red) values. The value zero
is not shown.
Current usage metrics show cumulative count of Article Views (full-text article views including HTML views, PDF and ePub downloads, according to the available data) and Abstracts Views on Vision4Press platform.
Data correspond to usage on the plateform after 2015. The current usage metrics is available 48-96 hours after online publication and is updated daily on week days.
Initial download of the metrics may take a while.