Fig. 8
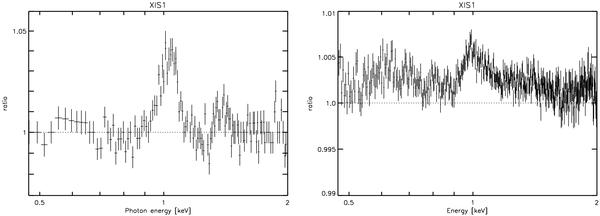
The simulated A 3112 XIS1 spectrum of the 3–6 arcmin region divided by the model prediction obtained from a fit to the 2.0–7.0 keV band data. Left panel: the simulated data contain the true emission from the 3–6 arcmin region and the PSF-scattered flux from the central 0.5 arcmin region. Right panel: the simulated data contain the true emission from the 3–6 arcmin region and the lower temperature components projected in the line of sight.
Current usage metrics show cumulative count of Article Views (full-text article views including HTML views, PDF and ePub downloads, according to the available data) and Abstracts Views on Vision4Press platform.
Data correspond to usage on the plateform after 2015. The current usage metrics is available 48-96 hours after online publication and is updated daily on week days.
Initial download of the metrics may take a while.