Free Access
Fig. 6
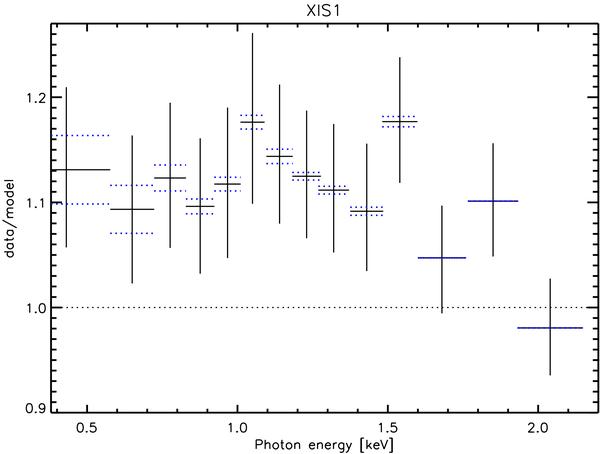
The black crosses are repeated from Fig. 4 (the ratio of the data and the best-fit model for XIS1). The blue dotted line shows the ratio when the model is adjusted by reducing or adding the absorption due to uncertainties in the modeling of the contamination (see text). The black dotted line shows the data/model 1:1 ratio.
Current usage metrics show cumulative count of Article Views (full-text article views including HTML views, PDF and ePub downloads, according to the available data) and Abstracts Views on Vision4Press platform.
Data correspond to usage on the plateform after 2015. The current usage metrics is available 48-96 hours after online publication and is updated daily on week days.
Initial download of the metrics may take a while.