Fig. 4
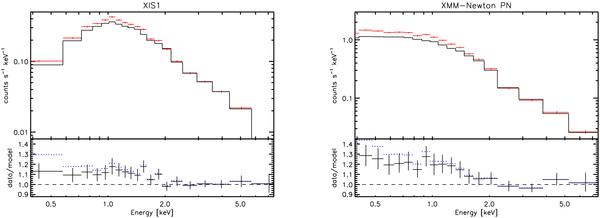
The background-subtracted data (red crosses) of the 3–6 arcmin annulus are shown with the thermal model prediction extrapolated from the 2–7 keV band (solid black line) in the upper panels. The data are binned using a minimum of 2000 counts per bin for clarity. The ratio of the data and the extrapolated model is shown with black crosses in the lower panels. The error bars include the effect of the statistical uncertainties on the hard band model. The dotted blue line shows the results of using NH from Dickey & Lockman (1990). The results are shown for XIS1 (left panel) and XMM-Newton PN (right panel).
Current usage metrics show cumulative count of Article Views (full-text article views including HTML views, PDF and ePub downloads, according to the available data) and Abstracts Views on Vision4Press platform.
Data correspond to usage on the plateform after 2015. The current usage metrics is available 48-96 hours after online publication and is updated daily on week days.
Initial download of the metrics may take a while.