Free Access
Fig. 2
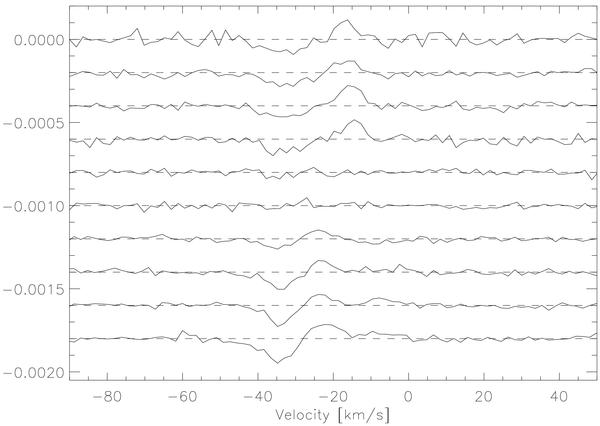
LSD Stokes V profiles for EK Boo for the dates listed in Table 1, from 03 Apr. 08 (top) to 18 Mar. 09 (bottom). The dashed lines illustrate the respective zero levels. The scale of the Y-axis is in units of V/Ic, Ic is the intensity of the continuum. For clarity, successive profiles are shifted vertically.
Current usage metrics show cumulative count of Article Views (full-text article views including HTML views, PDF and ePub downloads, according to the available data) and Abstracts Views on Vision4Press platform.
Data correspond to usage on the plateform after 2015. The current usage metrics is available 48-96 hours after online publication and is updated daily on week days.
Initial download of the metrics may take a while.