Fig. 6
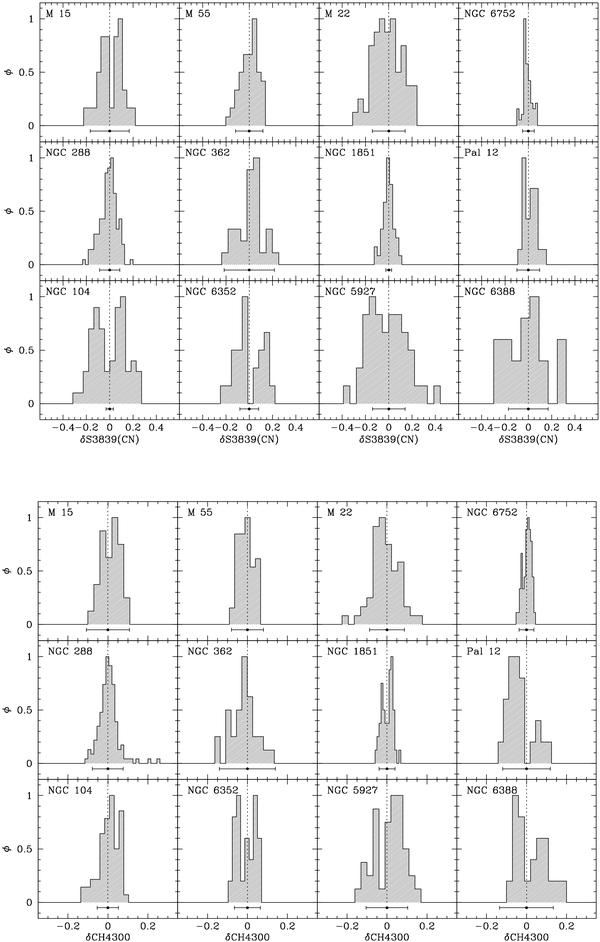
Histograms of the δS3839(CN) (top panels) and δCH4300 (bottom panels) index strengths. The bin sizes are larger for clusters with lower S/N and/or fewer stars. Typical (median) errorbars are plotted below each histogram. Vertical dotted lines mark δS3839(CN) = 0 and δCH4300 = 0, i.e. the median ridge line of the rectified index and the border between CN or CH strong and CN or CH weak stars. Clusters are sorted by increasing metallicity, from left to right and from top to bottom.
Current usage metrics show cumulative count of Article Views (full-text article views including HTML views, PDF and ePub downloads, according to the available data) and Abstracts Views on Vision4Press platform.
Data correspond to usage on the plateform after 2015. The current usage metrics is available 48-96 hours after online publication and is updated daily on week days.
Initial download of the metrics may take a while.