Fig. 4
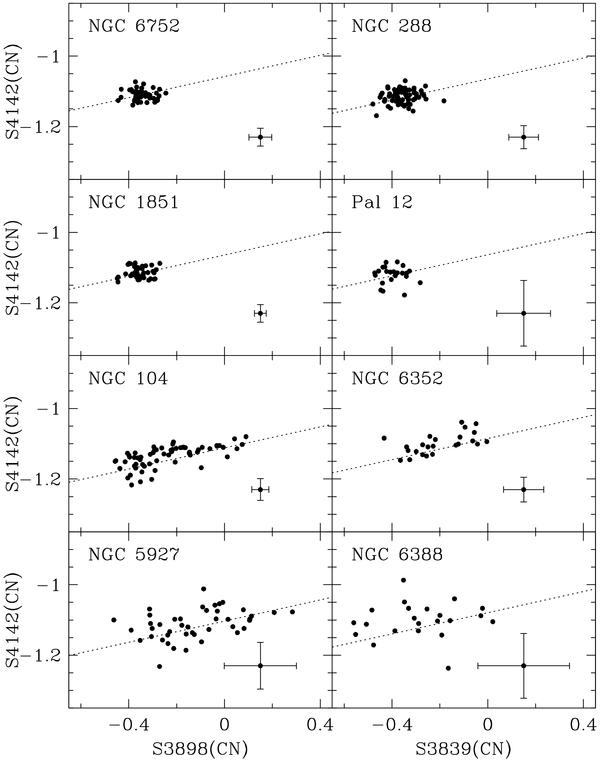
Comparison between the CN S3839 and the S4142 indices. Each panel shows measurements for the indicated cluster, and the median errobar is also shown in the lower right corner. Clusters are sorted by metallicity, from the most metal-poor (top-left) to the most metal-rich (bottom-right). Dotted lines are linear fits with a fixed slope (that of the whole sample) and rougly adjusted zeropoints.
Current usage metrics show cumulative count of Article Views (full-text article views including HTML views, PDF and ePub downloads, according to the available data) and Abstracts Views on Vision4Press platform.
Data correspond to usage on the plateform after 2015. The current usage metrics is available 48-96 hours after online publication and is updated daily on week days.
Initial download of the metrics may take a while.