Fig. 3
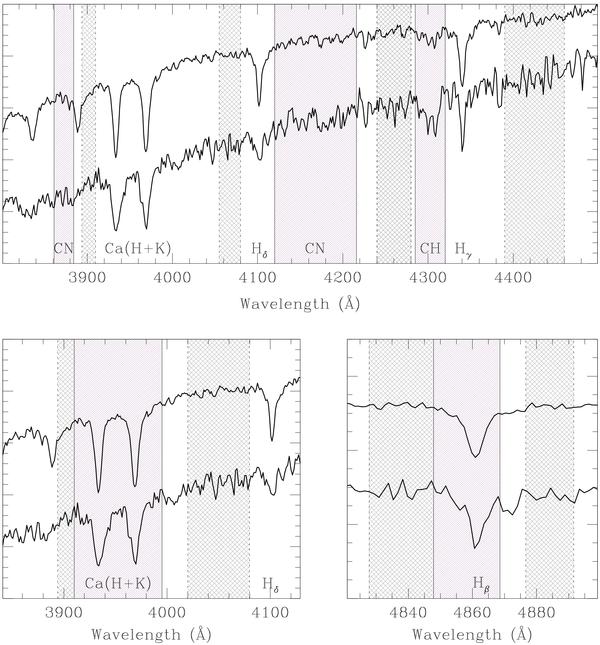
Two spectra of CN-weak, CH-strong stars with different S/N ratio are shown as examples of our best and worst data: the upper spectrum in all panels has S/N ≃ 25 (on the S3839(CN) band) and belongs to NGC 1851; the lower spectrum has S/H ≃ 10 and belongs to NGC 6388. Both are shifted on an arbitrary flux scale for sake of clarity. The top panel illustrates the chosen windows used for the CN and CH indices (magenta hatched regions) along with their respective continuum windows (grey hatched regions); while the bottom panels show the windows adopted for the H and K Calcium index (bottom left) and the Hβ index (bottom right).
Current usage metrics show cumulative count of Article Views (full-text article views including HTML views, PDF and ePub downloads, according to the available data) and Abstracts Views on Vision4Press platform.
Data correspond to usage on the plateform after 2015. The current usage metrics is available 48-96 hours after online publication and is updated daily on week days.
Initial download of the metrics may take a while.