Fig. 1
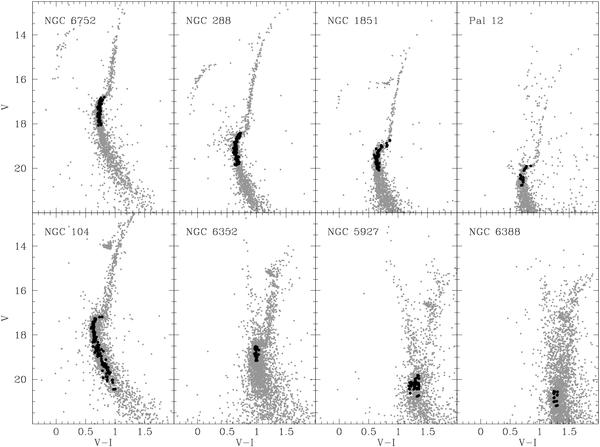
Colour − magnitude diagrams for the newly observed GGC in our sample. Grey dots show our pre-imaging V, V − I photometry, calibrated with literature data (see text). For 47 Tuc, which was not part of our original observations, we used the photometry by Rosenberg et al. (2000). A selection on the photometric parameters from DAOPHOT II is applied to show only the best measured stars. Black dots mark spectroscopic targets. Clusters are ordered as a function of their metallicity from the most metal-poor (top left) to the most metal-rich (bottom right).
Current usage metrics show cumulative count of Article Views (full-text article views including HTML views, PDF and ePub downloads, according to the available data) and Abstracts Views on Vision4Press platform.
Data correspond to usage on the plateform after 2015. The current usage metrics is available 48-96 hours after online publication and is updated daily on week days.
Initial download of the metrics may take a while.