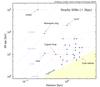
Fig. 9
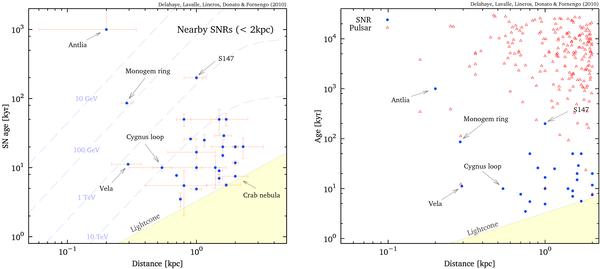
Left: plot of the observed age versus distance to the Earth for our sample of local SNRs (and associated uncertainties, see Table C.1). The dashed lines correspond to limits beneath which a local source cannot contribute significantly to the signal at the corresponding energy (valid only in the med propagation model – see Table 1). Indeed the age sets an upper limit, while the distance sets a lower limit to the energy range – see Sect. 4.4. Right: same plot for our complete sample of local SNRs and pulsars.
Current usage metrics show cumulative count of Article Views (full-text article views including HTML views, PDF and ePub downloads, according to the available data) and Abstracts Views on Vision4Press platform.
Data correspond to usage on the plateform after 2015. The current usage metrics is available 48-96 hours after online publication and is updated daily on week days.
Initial download of the metrics may take a while.