Fig. 7
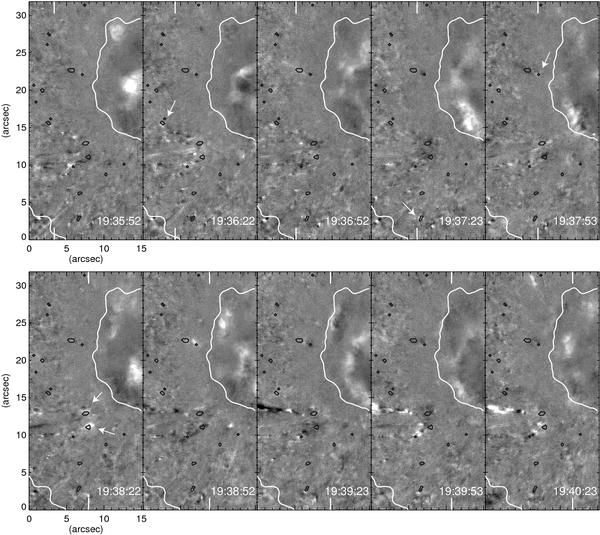
FG Ca II H images processed with the temporal high-pass Fourier filtering. The images were obtained between 19:35:52 and 19:40:23 on 7 Jan. 2007 simultaneous with the SP scan. The FOV covers the disk-center side penumbra. The solid contours show V/Icq = −0.015 at +280 mÅ from 6301.5 Å indicating the downflow patches as in Fig. 4. The white contours on each panel represent the boundaries between the umbra and the penumbra and between the penumbra and the quiet Sun. The thick white vertical lines in each Ca II H image indicate positions of the SP slit at each Ca II H exposure. The arrows indicate the downflow patches that are coincident with brightenings in the Ca II H images.
Current usage metrics show cumulative count of Article Views (full-text article views including HTML views, PDF and ePub downloads, according to the available data) and Abstracts Views on Vision4Press platform.
Data correspond to usage on the plateform after 2015. The current usage metrics is available 48-96 hours after online publication and is updated daily on week days.
Initial download of the metrics may take a while.