Fig. 6
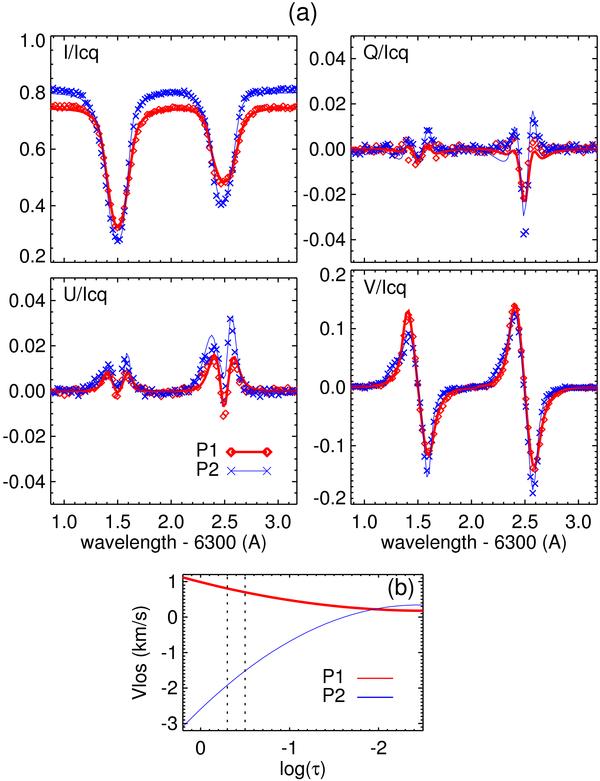
a) Stokes profiles observed inside (P1) and outside (P2) of the downflow patch. The diamonds and crosses show observed Stokes profiles at P1 and P2, respectively. The red and blue solid curves indicate best-fit profiles from the SIR inversion at P1 and P2, respectively. b) The stratifications of LOS velocity derived by the SIR inversion at P1 and P2. Positive (negative) velocities represent motion away from (toward) the observer.
Current usage metrics show cumulative count of Article Views (full-text article views including HTML views, PDF and ePub downloads, according to the available data) and Abstracts Views on Vision4Press platform.
Data correspond to usage on the plateform after 2015. The current usage metrics is available 48-96 hours after online publication and is updated daily on week days.
Initial download of the metrics may take a while.