Fig. 5
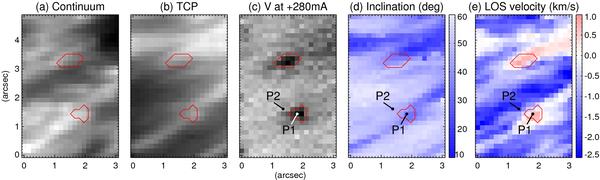
Close-up view of the downflow patches in the penumbra: a) a map of continuum intensities, b) total circular polarization (TCP), c) Stokes V signals at +280 mÅ from the line center of the 6301.5 Å line, d) magnetic field inclination angles from the local normal, and e) LOS velocities derived by the SIR inversion, where positive (negative) velocities represent motion away from (toward) the observer. The inclination angles and the velocities are averaged ones in optical depths from log (τc) = −0.3 to log (τc) = −0.5. P1 and P2 in panels c)–e) indicate pixels where the Stokes V profiles shown in Fig. 6a were observed. The contours on each panel represent V/Icq = −0.015 at +280 mÅ from 6301.5 Å.
Current usage metrics show cumulative count of Article Views (full-text article views including HTML views, PDF and ePub downloads, according to the available data) and Abstracts Views on Vision4Press platform.
Data correspond to usage on the plateform after 2015. The current usage metrics is available 48-96 hours after online publication and is updated daily on week days.
Initial download of the metrics may take a while.